Analytics
Analytics is available in the Dashboard section. It shows how your vehicles are used: how far they travel, how much fuel they consume, and how much time they spend driving or idling. Charts help you compare vehicles and track changes over a selected period.
You can view data for one or more vehicles, choose a date range, and display the metrics you need.

Select vehicles and a date range
1. Open Dashboard from the main menu
2. In the Objects list, select the vehicles you want to include. To view data for a single vehicle, leave only that vehicle selected
Use the search field 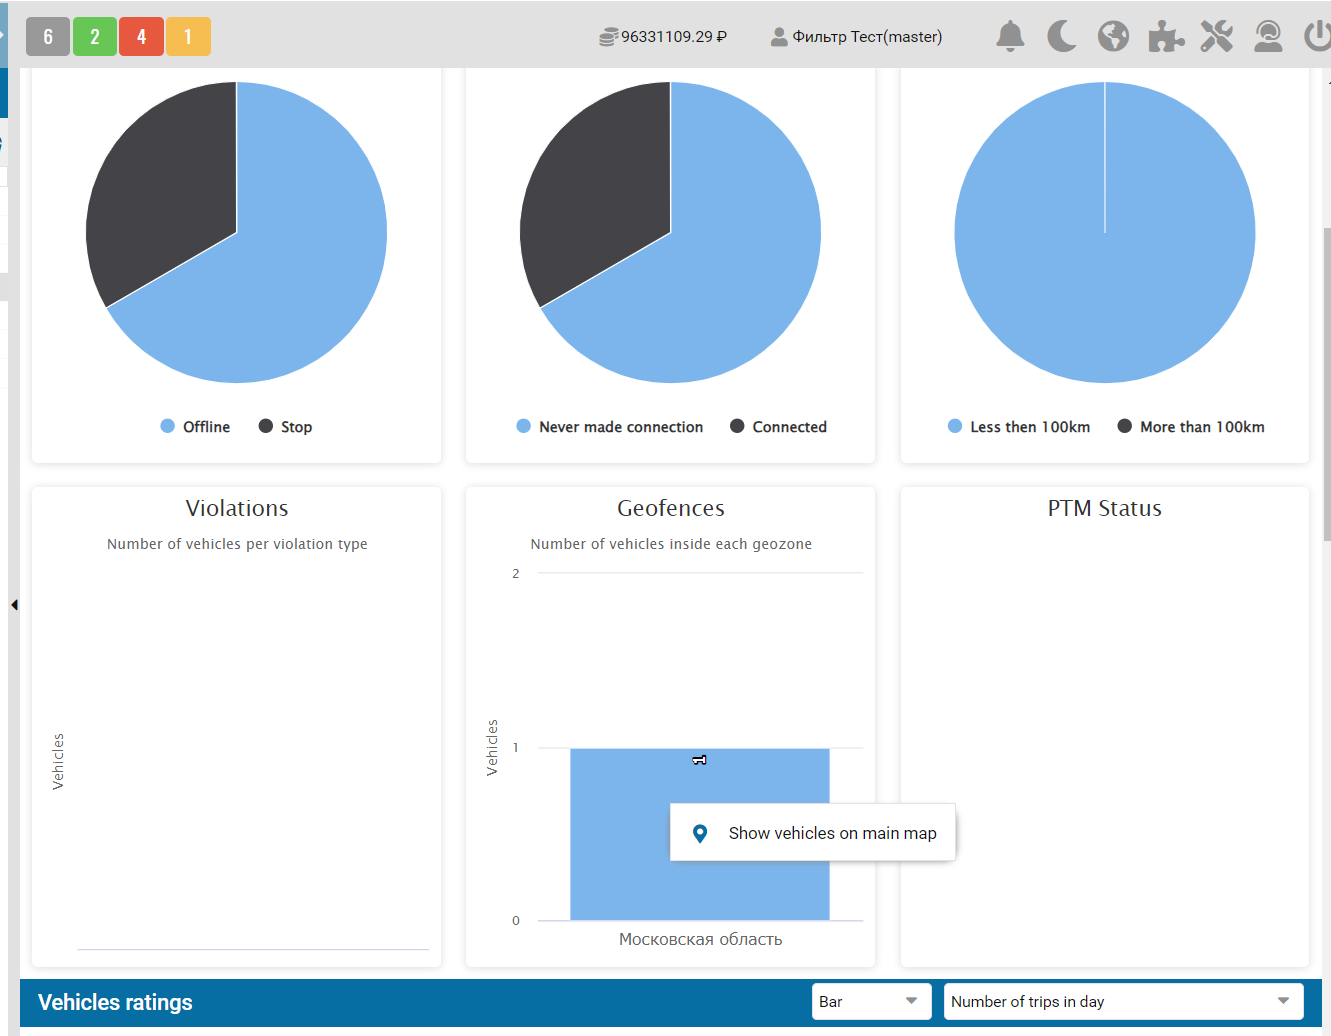 above the list to find a vehicle. The filter
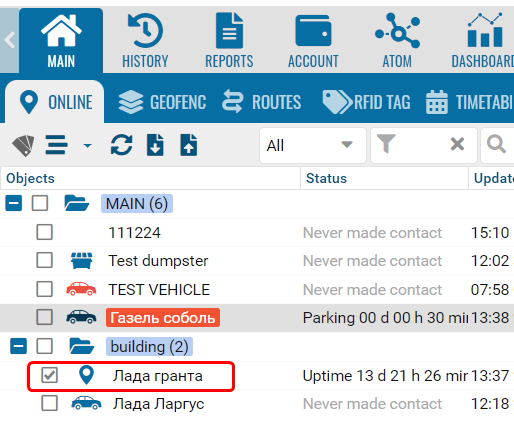 next to it helps narrow the list. To clear the search or filter, click the cross in the corresponding field
above the list to find a vehicle. The filter next to it helps narrow the list. To clear the search or filter, click the cross in the corresponding field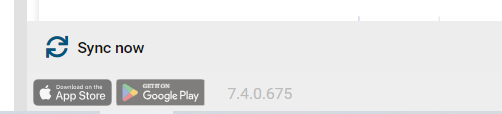
3. Set the Start Date and End Date. Both dates are included in full in the selected period

4. Click 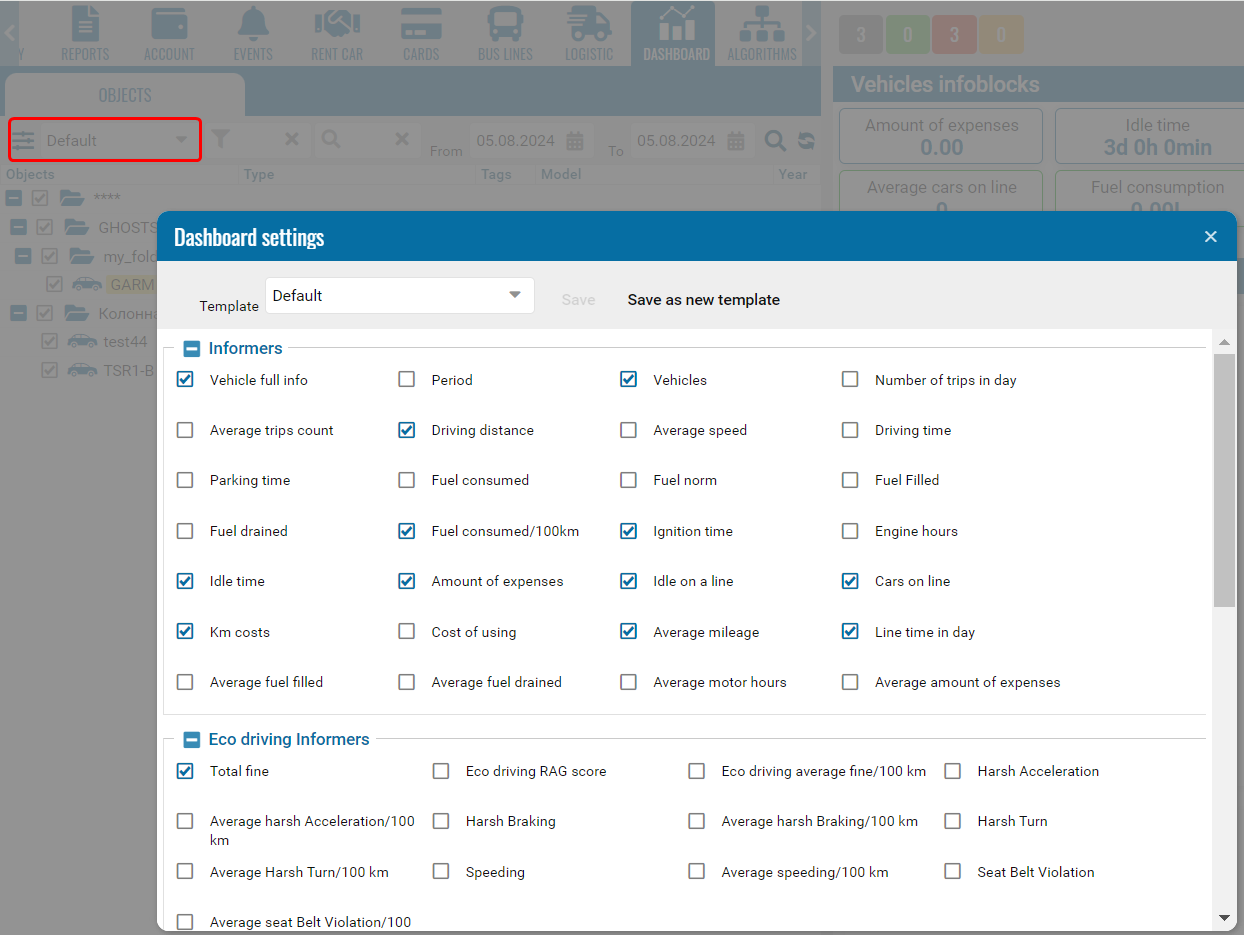
The Dashboard will display data for the selected vehicles and date range
At the top, Vehicles infoblocks show totals and averages. Charts, diagrams, and vehicle rankings appear below.
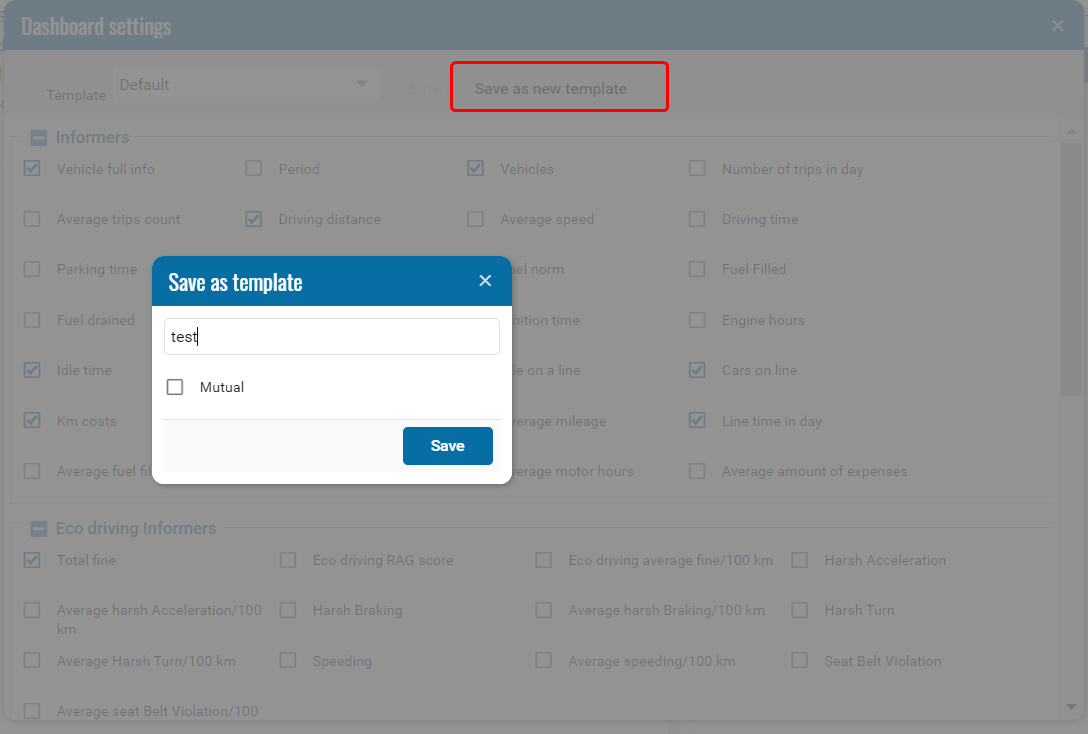
The available metrics depend on your dashboard settings, enabled modules, and available data.
How date ranges work in Analytics and Reports
Analytics uses daily totals: both Start Date and End Date are included in full. You cannot select specific hours.
For example, to view data for October, select 1 October to 31 October. If you select 1 November as the End Date, data for that entire day will also be included.
In Reports, you can specify exact start and end times. For example, a period from 1 October at 00:00 to 1 November at 00:00 covers the whole of October.
To compare figures, select the same vehicles and make sure the report covers the same full calendar days as Analytics.
Refresh the data
Click Sync now at the bottom of the Dashboard to refresh the data. The date and time of the last update appear next to it.

Export the Dashboard to PDF
1. Select the vehicles and date range
2. Apply the template you want to use and load the data
3. Click Export in the bottom-right corner

A PDF file containing the dashboard analytics will download.