Fluids Report
This type of report presents information in the form of a graph that displays changes in speed and fluid levels. Fillings and drains are marked with characteristic icons, by clicking on which additional information pops up.
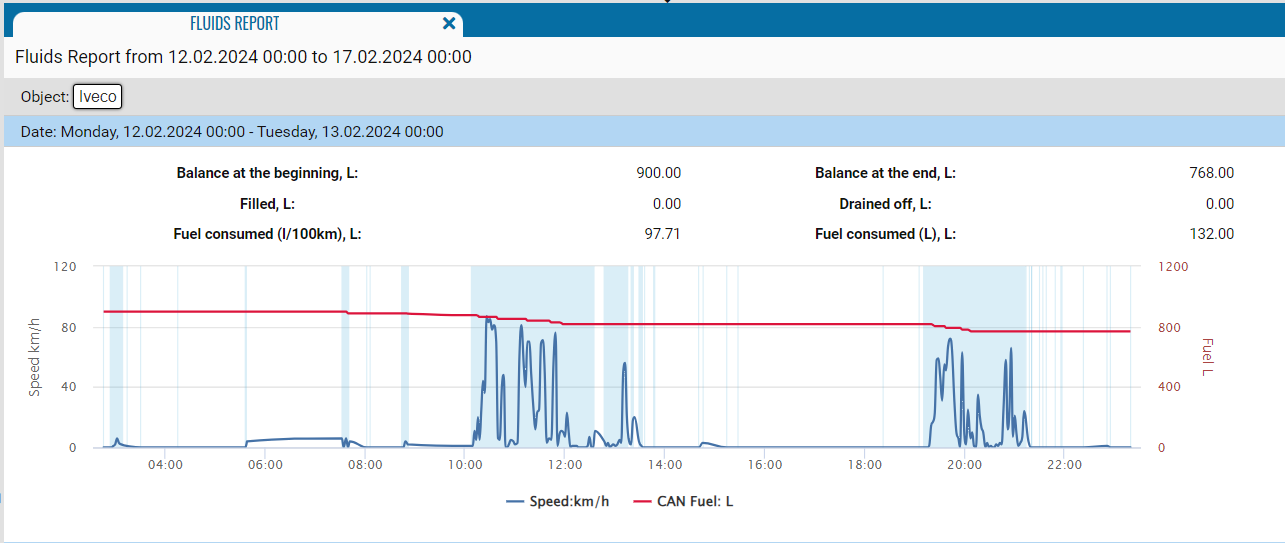
The report contains:
• Object - the monitoring object for which the graph is being built.
• Date - the period of time for which the chart is built.
• Balance at the beginning, l - the amount of fuel in the tank at the beginning of the specified date.
• Balance at the end, l - the amount of fuel in the tank at the end of the specified date.
• Filled, l - the amount of fuel filled on the specified date.
• Seizure, l - the amount of fuel seized on the specified date.