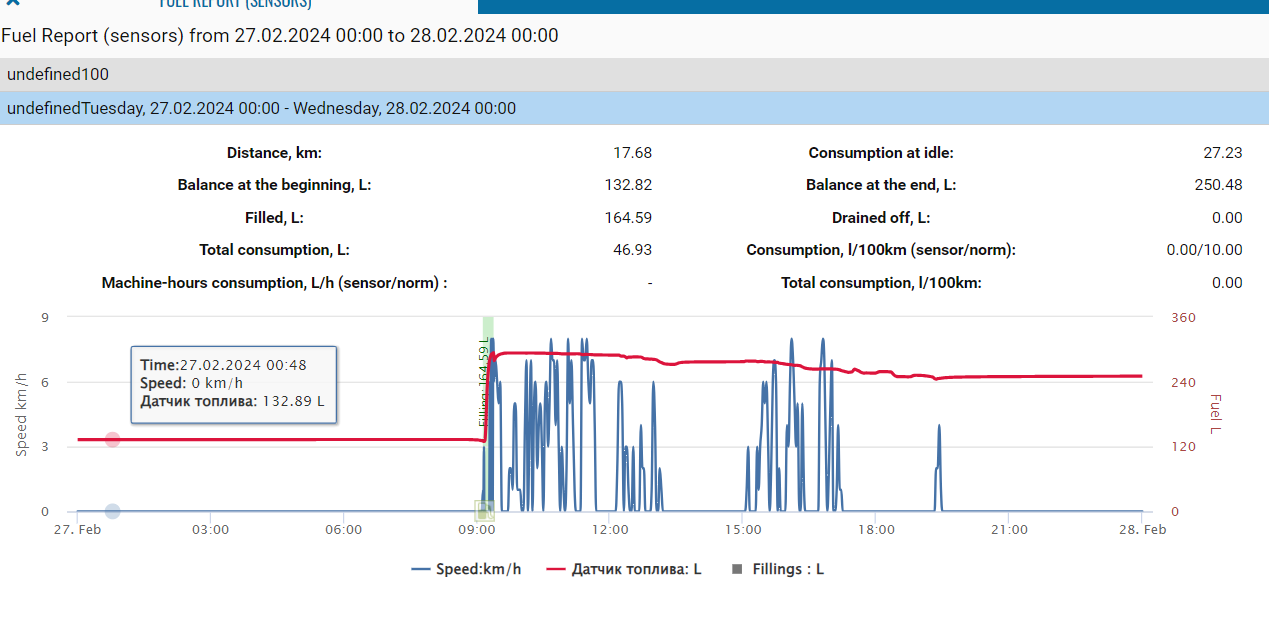
Fuel Report (sensors)
This type of report presents information in the form of a graph that displays changes in speed and fuel level. The blue area on the graph corresponds to the time when the ignition sensor was in the "on" position (if the sensor is present). Fillings and drains are marked with characteristic icons, by clicking on which additional information pops up.
The report contains:
• Object - the monitoring object for which the graph is being built.
• Date - the period of time for which the chart is built.
• Mileage, km - mileage of the monitored object for the specified date.
• Balance at the beginning, l - the amount of fuel in the tank at the beginning of the specified date.
• Balance at the end, l - the amount of fuel in the tank at the end of the specified date.
• Filled, l - the amount of fuel filled on the specified date.
• Drained, l - the amount of fuel drained on the specified date.
• Total consumption, l - the amount of fuel consumed for the specified date.
• Consumption, l/100 km (sensor/norm) - the amount of fuel consumed per 100 km of run according to the sensor readings (calculated as (Consumption * 100 km)/Mileage) / the amount of fuel consumed per 100 km of run according to the established norm (the norm is set in fuel tab).
• Consumption at Idling - the amount of fuel consumed in the absence of speed at the monitored object.
• Machine- hours consumption , l/h - the amount of fuel consumed per engine hour, calculated as Total consumption/Motor hours.
