How to work with Velavu objects
With the Velavu integration in PILOT, you can track the location of objects inside buildings in real time — see which floor, room, or zone your equipment and personnel are in.
In this article, we'll cover:
Once the Velavu integration is connected, the Climate module lets you switch between two modes:
-
Standard — the regular Climate module mode for working with temperature and humidity sensors
-
Velavu — the mode for displaying Velavu objects1. Open the Climate module

2. On the Climate tab, use the dropdown list to switch the mode from Normal to Velavu

3. The interface will switch to Velavu mode
In Velavu mode, instead of the usual temperature and humidity sensors, you'll see a tree of Velavu objects.
For each item in the tree, the following is typically displayed:
-
Name — for example, Velavu-00Q6N
-
Type — for example:
-
ANCHOR — anchor
-
TAG — tag
-
Device — device

At the top of the window in Velavu mode, you have access to:
To make Velavu objects appear in the Climate module, you first need to set up the objects in the system.

1. Create a monitoring object. For details on how to create an object, see the separate article
2. In the object's card, specify the object identifier from the Velavu system

3. After this, you can configure additional object settings, such as:
-
choosing an icon
-
setting a color
-
filling in other parameters4. Run synchronization
Once your objects are ready, go to the Climate module and synchronize the structure.
Synchronization loads the Velavu object structure and displays it in the Climate module:
1. Open the Climate module
3. Click the Sync button 

4. The system will load buildings, floors, and devices from the Velavu API.
After synchronization, the entire structure will appear in the object tree, grouped by accounts, buildings, and floors.
-
If you click an object in the tree on the left, the corresponding object on the floor plan will be highlighted.
-
If you click an object on the floor plan, it will be automatically selected in the object list.
The module can show several types of objects:
-
Anchors — fixed reference points used to calculate the position of other devices
-
Tags — markers usually attached to equipment, people, or other objects. Once anchors are set up, the position of tags is calculated automatically
-
Proximity tags — tags that are detected within the range of another object

Velavu objects appear on the plan as colored circles. The color indicates the object's type and status:
|
Color
|
Object type
|
Description
|
|
Blue
|
Anchor
|
A fixed positioning point installed in the room
|
|
Green
|
Tag
|
A movable object — equipment, vehicle, or personnel
|
|
Yellow
|
Proximity Tag
|
A tag located within the range of another object
|
|
Red
|
Offline
|
The object isn't transmitting data or is out of coverage
|
If you hover over an object in the list or on the plan, a tooltip with brief information about the object will appear.
The tooltip shows:
-
Name — the object's name in the system
-
Agent ID — the object's internal identifier
-
Device ID — the Velavu device identifier
-
Location type — the type of object placement
-
Coordinates — the object's current coordinates
-
Site — the name of the site the object belongs to
-
Floor — the floor the object is on
-
Status — the device's current state: online or offline
This tooltip helps you get key information about an object without opening its full device card.


A detailed card with full information is available for every Velavu device. To open it, click the view icon next to the object in the tree.

The device card opens in a separate window with several tabs:
Overwiew
This tab shows general details about the device: where it's located, what it's linked to, and its current status.

-
Device name — the device's name in the Velavu system, e.g., Velavu-Sp8mv
-
Device ID — the unique device identifier, e.g., Sp8mv
-
Site — the name of the site where the device is installed, e.g., GARGASH
-
Floor — the floor where the device is located, e.g., Level 1 - GR001
-
Connection status — the device's current state: online or offline
Below is the Assignment block, which may show information about the asset:
-
Asset name — which asset the device is linked to
-
Asset group — the group the asset belongs to
-
Asset category — the asset's category
-
Operation — the asset's current action or state
At the bottom of the tab, you'll see:
-
Last update — the date and time when data was last received from the device
Location
The Location tab shows information about where the device is located.
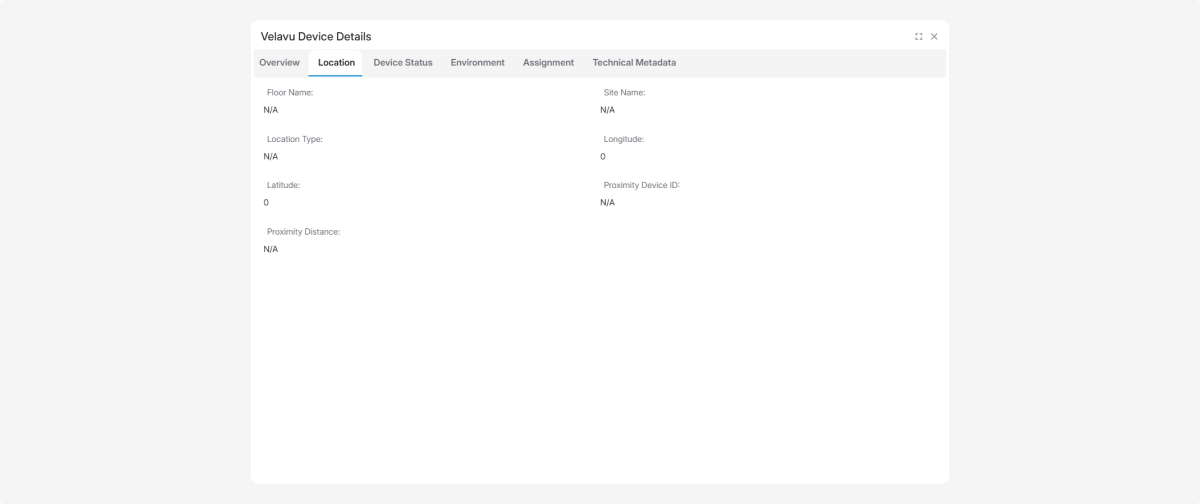
Here you can see:
-
Floor name — which floor the device is on
-
Site name — which site the device is at
-
Location type — how the device is placed
-
Latitude — the current latitude value
-
Longitude — the current longitude value
-
Proximity device ID — the identifier of the nearest device
-
Proximity distance — the distance to the nearest device
Device status
The Device status tab shows the device's current technical condition.

Battery state
This block may show:
-
Battery level — the battery charge percentage, e.g., 90%
-
Battery charging — whether the device is plugged in to charge
Connection
Here you'll see:
-
Connection status — online or offline
-
RSSI — the signal strength
-
Gateway ID — the identifier of the gateway the device is connected through
-
Signal level — the connection quality
Motion and activity
This block shows:
-
Motion detection — whether the object is moving or stationary
-
Last activity — the date and time of the device's last activity
Environment
This tab shows data from environmental sensors, if the device supports temperature, humidity, or pressure measurement.

Here you can see:
-
Temperature — current value in °C
-
Humidity — current value in %
-
Pressure — current value in kPa
Below is the History charts block.
If data is available, it shows charts of how temperature, humidity, and pressure have changed over time.
Above the charts, you can choose the time period: 1h — 1 hour, 6h — 6 hours, 1d — 1 day, 7d — 7 days, 30d — 30 days, All — the full available period.
Assignment
The Assignment tab shows information about which asset the device is linked to.
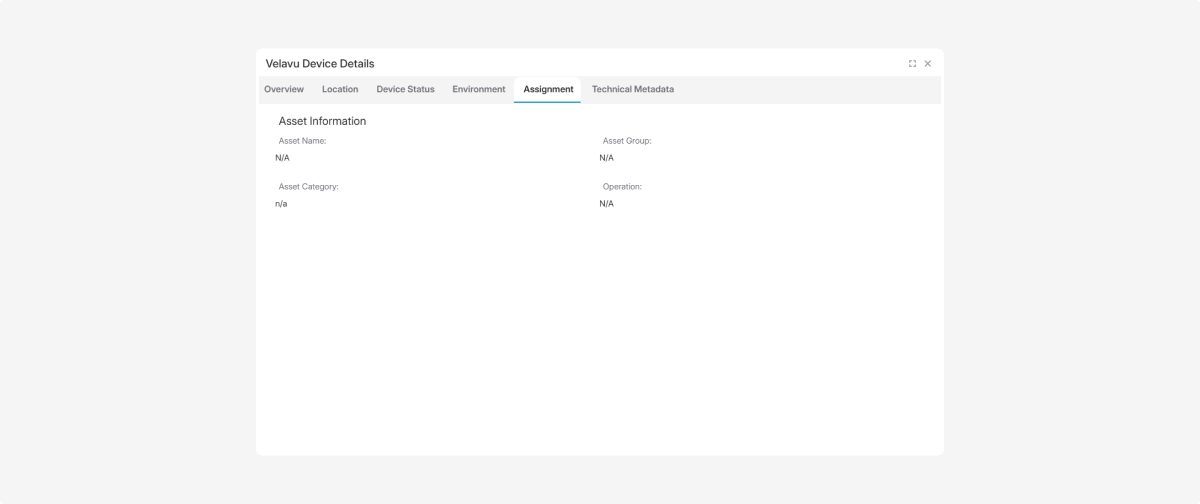
Here you'll typically see:
-
Asset name — which asset the device is linked to
-
Asset group — the group the asset belongs to
-
Asset category — the asset's category
-
Operation — the asset's current action or state
If asset data isn't filled in, the fields may show N/A.
Technical data
The Technical data tab shows additional service information about the device.

Depending on the device, the following may be available:
-
Firmware / model
-
Beacon interval
-
Heartbeat frequency
-
Status update frequency
-
Temperature and humidity update frequency
-
Beacon transmission power
-
Site ID
-
Floor ID
A context menu with additional actions is available for Velavu floors and sites. To open the menu of object actions, right-click on a Velavu object.

Through this menu you can:


To show anchors, choose Show anchors in the menu. They will appear on the plan and in the list.

To hide them, choose Hide anchors in the menu.

For an individual Velavu device, the context menu offers:
-
Remove object
This action removes the link between the device and the Velavu room.

Velavu geofences are loaded into the system automatically from Velavu. You don't need to create them manually in PILOT.
Just set up your sites and buildings in Velavu, then click the Sync button  in Velavu mode within the Climate module — and the system will automatically import the geofences, the site and floor structure, and the linked devices.
After that, Velavu geozones will appear in the Geofences section in a dedicated folder.
