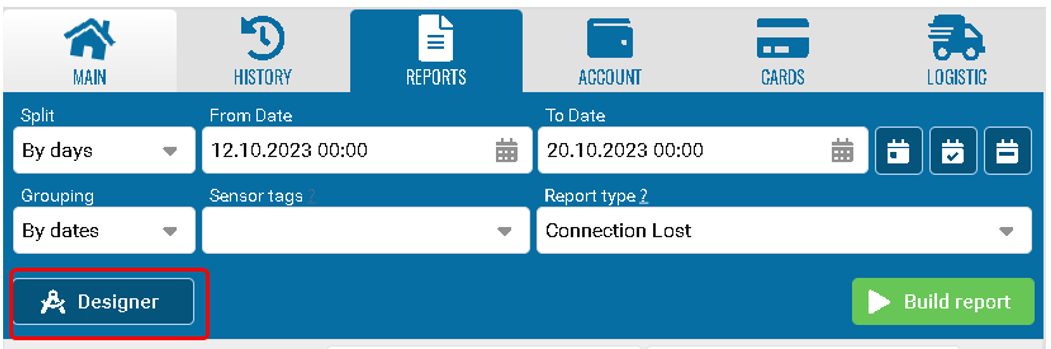
Report Builder

 
The Report Designer is intended for independent generation of output of the required parameters in the report.
Four types of reporting are available to the user: in the form of a graph, in the form of a summary table, in the form of sensor operation and sensor events flow.
To open the designer window, click the Report Designer button in the Reports section.
 
 
Select the plus icon in the report builder.
 
 
When creating a new report designer, you will need to select the type of the designer:
 
 
There are many constructor options available:
Here are some common examples of work
 
• Graph - creates a graph based on the selected functions, more details in the graph section;
• Pivot table - creates a table with information based on the selected fields and formulas, more details in the pivot table section;
• Sensor operation - similar to the pivot table, but each record in the report is the fact of operation of one of the equipment sensors, more details in the sensor operation section;
• Sensor event stream - similar to the pivot table, but records are created by changing the state of sensors, more details in the sensor event stream section
 
A report from the report designer can be transferred to other contracts using the export and import buttons.
The report will be exported to a json file in the selected account.
This can also be done in bulk.
You need to go to the admin panel, select contracts and click on the file.
This report will be available to all users of the contract.


In the report designer, you can search by initial letters of names from the data list.


Configuration {"split": "hour"} for report detailing by hourly intervals.
Each hourly period is represented as a separate segment in the report.
 
 
Once the report is complete, you will have the option to choose to sort the report by tags.
• Select a report.
• Group by tags.


 Working with total values ​​in reports.
 
• Type none - when selecting the function none, the total values ​​of the column are not summed up.
• Type Sum - when selecting this type of value, an additional total for the selected field will appear.
• Type Average - the average value is obtained mathematically, i.e. the total value divided by the number of objects in the report.
• Type Max. - the maximum value for this type.
• Type Min. - the minimum value for this type, for example, speed.
• Type Formula - taking into account the formula when deriving the value.
 
Example
 
Type sum
 
Type Average
 
 
Type Max.
 
 
Type Min.