Routes module
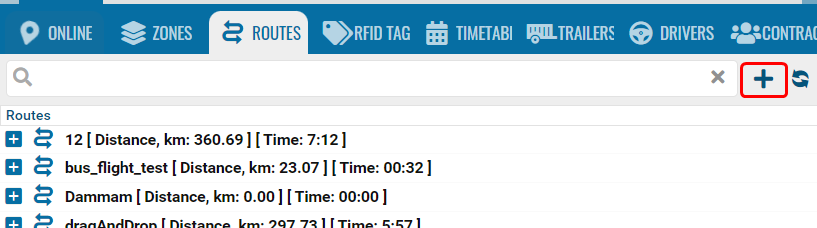
• Go to tab.
• Add +.
• Name - the name of the route.
• Detection range (km)* - the distance from the car to the nearest route point (not a checkpoint), which will be considered that the car is on the route. You can specify a fractional number.
• Geocoder - a geocoding service that we use to display at what address the checkpoint is located.
• Check time - a section where you can specify the estimated time to complete the route in hours and minutes. The setting is displayed in reports.
• Percentage of route completed - here you can specify how much of the route the car needs to travel in percentage so that it is displayed in the report.
• Save route.
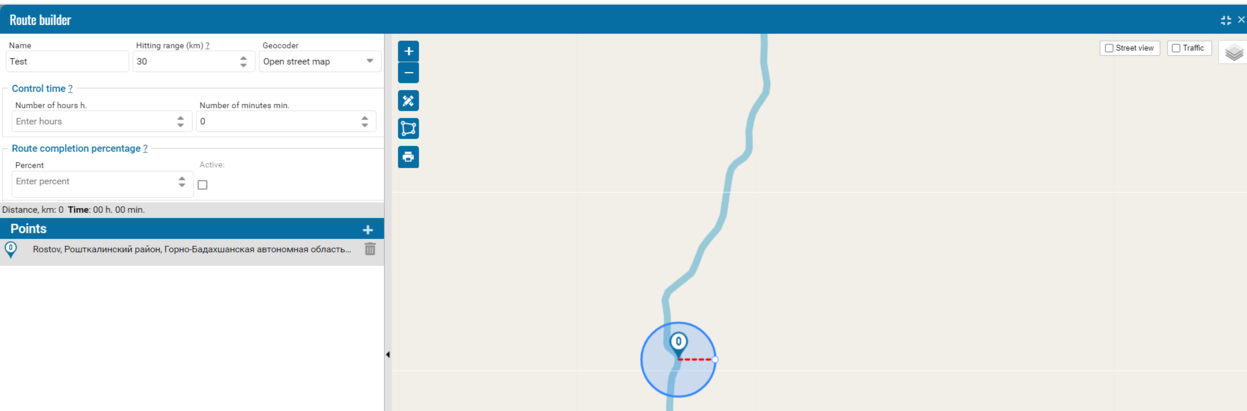
The checkpoint figure shows checkpoint 0.
The red arrow indicates the radius. This radius is needed to determine whether the car has entered the checkpoint or not.
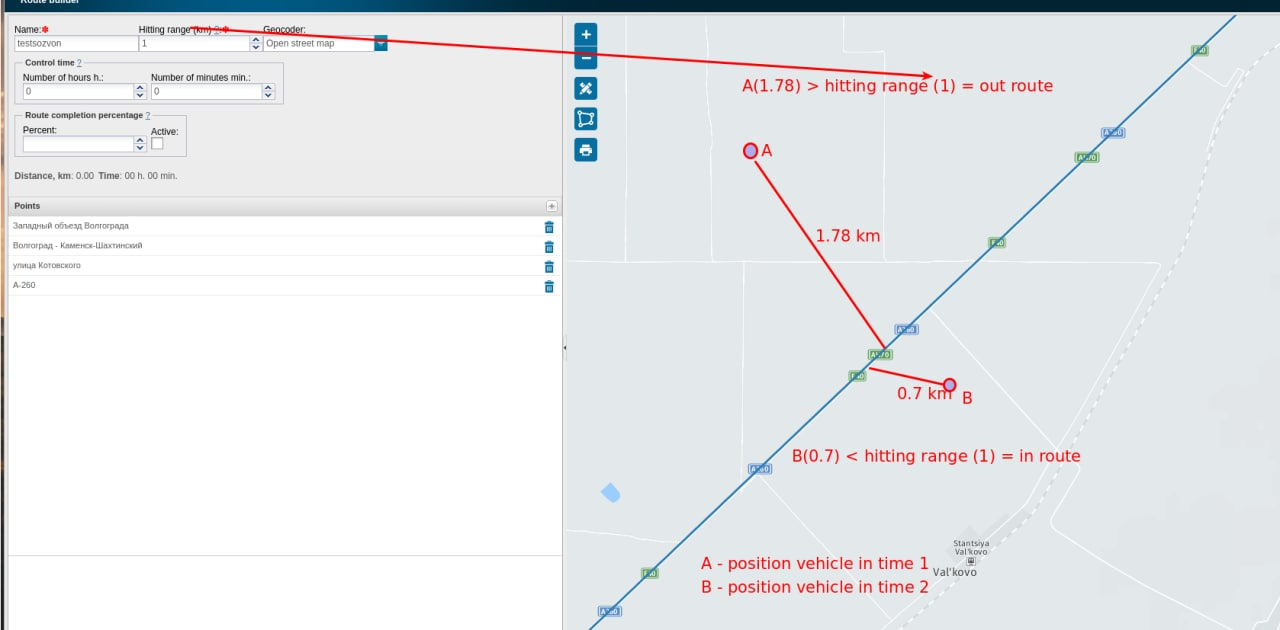
*Let's consider an example of the hitting range parameter.
Circles A and B on the diagram are the positions of the object at different times.
The lines from the red circles A and B to the blue line are the distance of the car to the route.
When this distance is exceeded (hitting range), we consider that the car has left the route.
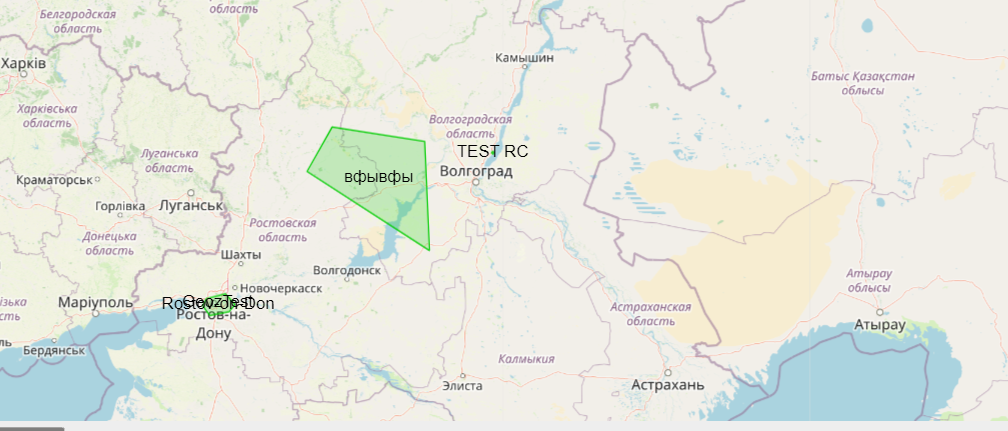
Geozones can also be displayed in this module.
Reports for this module are in the Reports section.