Speed report
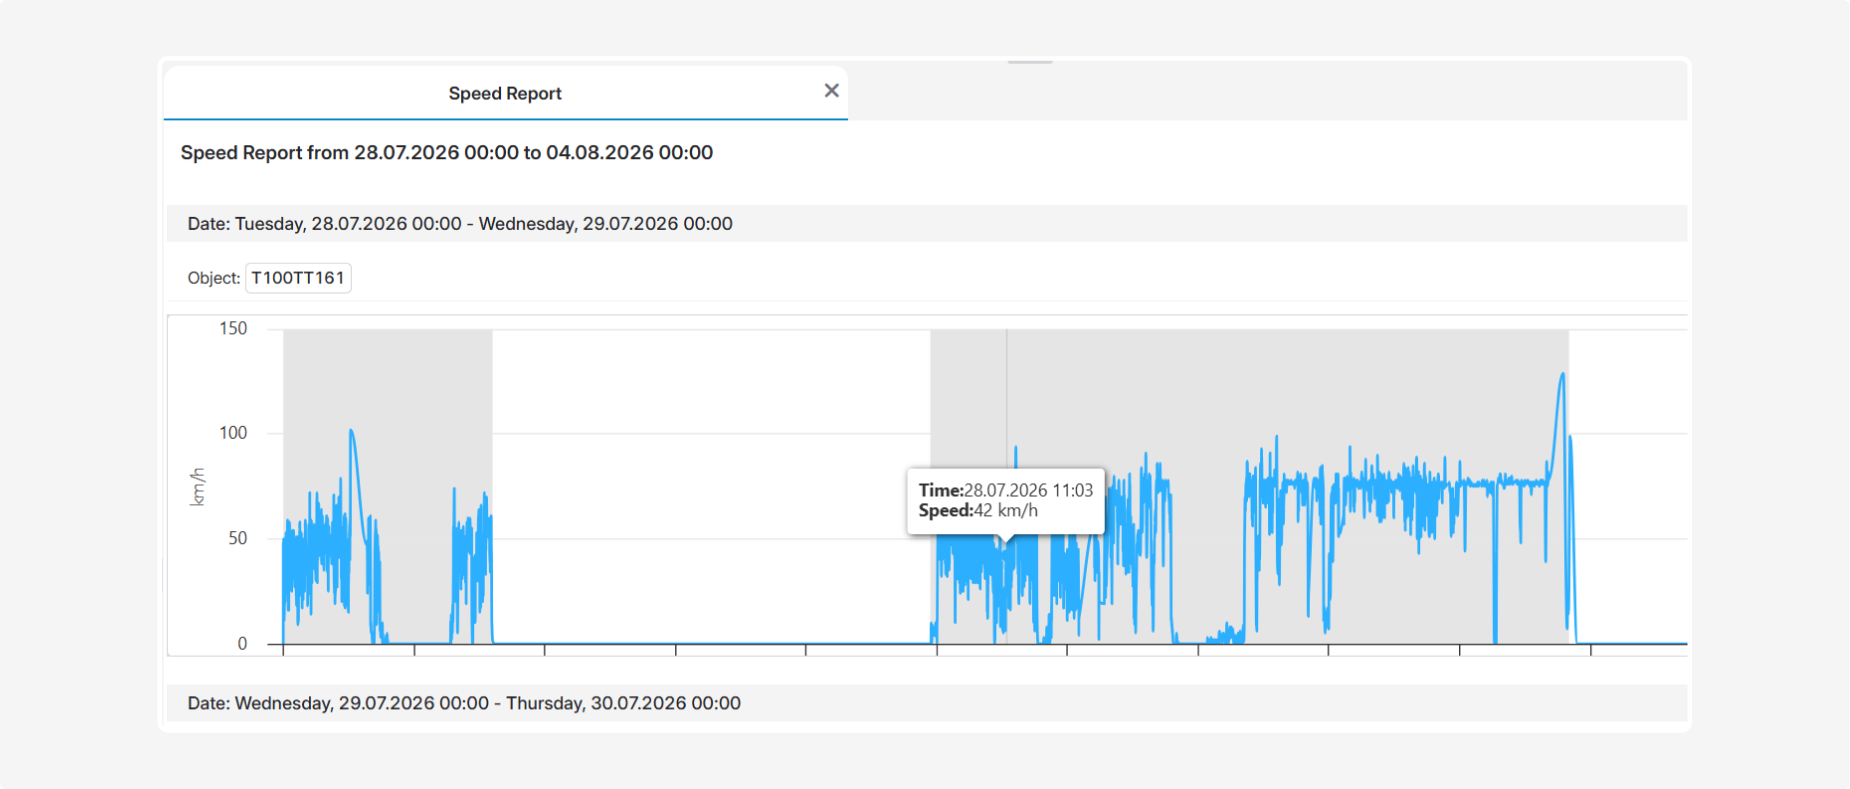
The Speed report contains graphs showing changes in the speed of selected vehicles over the specified period. It allows you to track speed trends, identify periods of movement and stopping, and detect sudden changes or high-speed values.
A separate graph is generated for each selected object and time interval.
What the graph shows
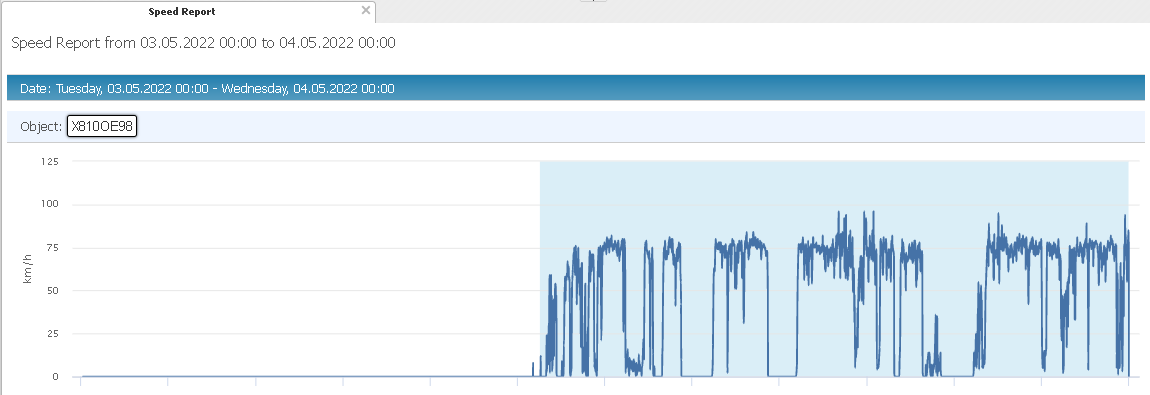
• Horizontal axis — the date and time when the data was recorded
• Vertical axis — the vehicle speed in km/h
• Blue line — changes in the object’s speed over time
• Zero value — the object was not moving at that moment
• Gaps in the graph may indicate that no data was received during the corresponding period
Hover over the line to display a tooltip with the date, time, and speed of the object at the selected point on the graph.