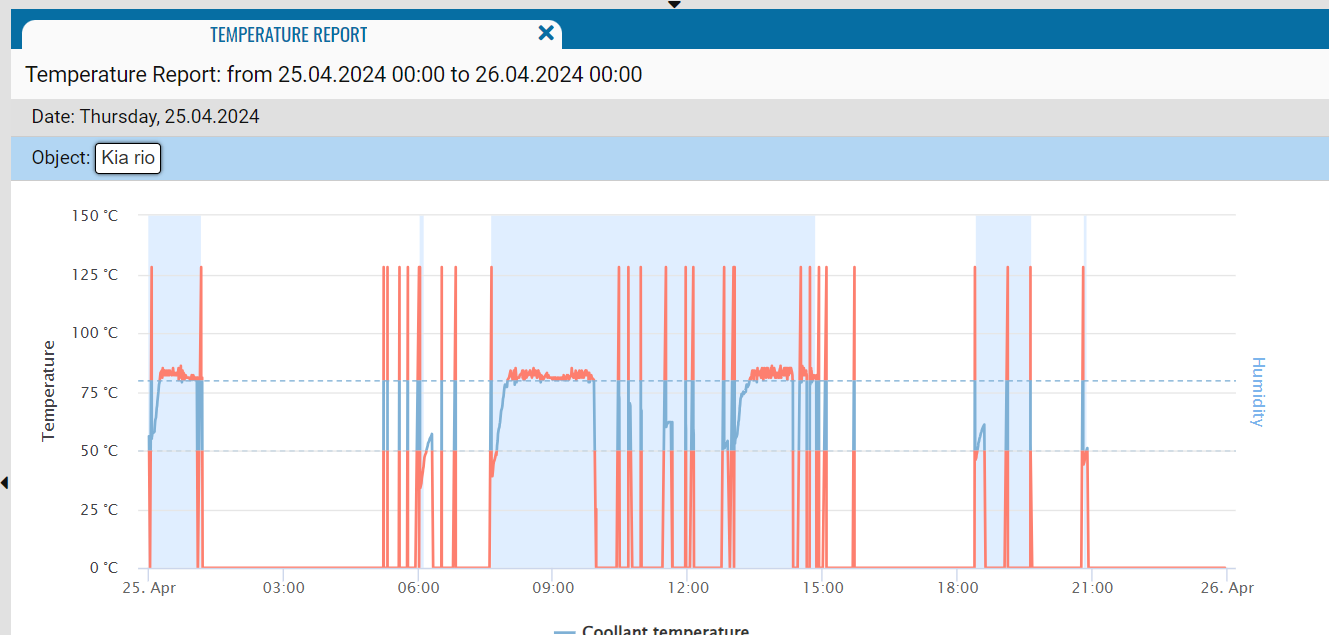
This type of report presents information in the form of a graph that displays changes in temperature and speed over a given period of time. When moving the mouse cursor over the graph, a pop-up window is displayed with data on speed and temperature at a particular point in time.
How to set a range for a report?
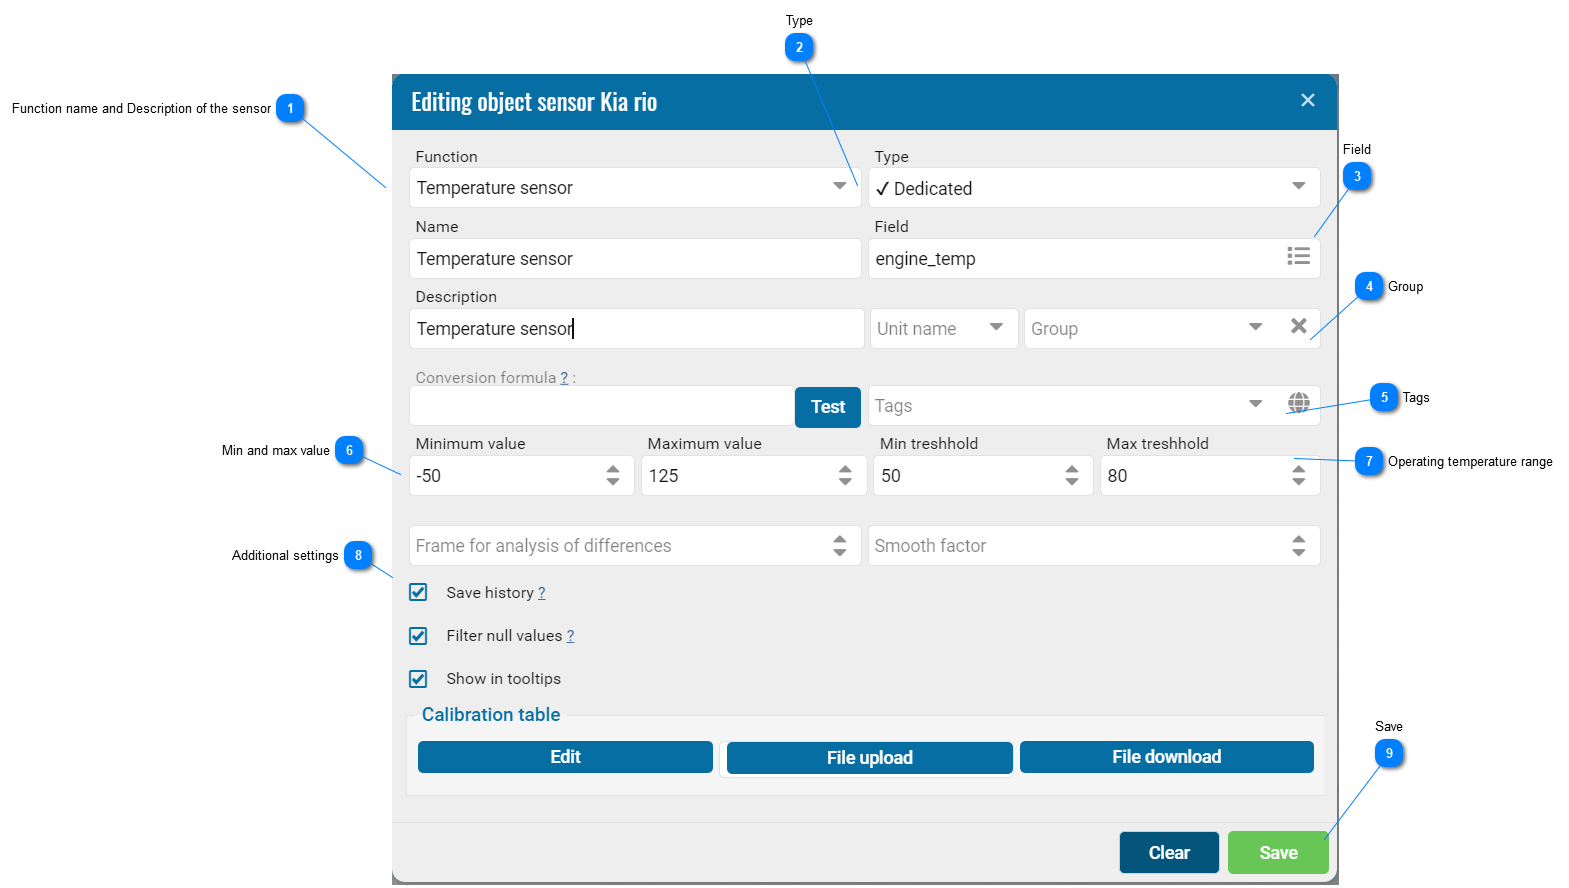
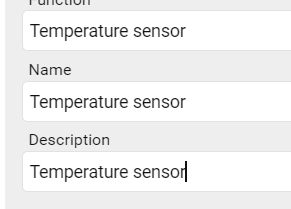
 Function name and Description of the sensorAfter adding a sensor to the system, you should give a name and description of the sensor.
|
 TypeSensor type.
|
 FieldSensor field value from raw data.
Depending on the setup and configuration of the sensor, the field must be selected from the list.
|
 GroupGrouping sensors by type.
|
 TagsTags are intended for grouping sensors, for creating reports on specific sensors (ignition, fuel, etc.).
In order to add a tag to the system, you need to click on the add button, then enter the name of the sensor group, which will be displayed when selecting groups in reports, select the sensor type, enter a custom description and select a color.
|
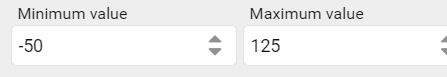
 Min and max valueDesigned to ignore invalid values or error codes. For example, the system will cut off a temperature value of 2000 - 3000 thousand and not take it into account when generating reports.
|
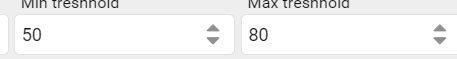
 Operating temperature rangeРабочий диапазон температуры датчика, на графике он выделен пунктиром.
|
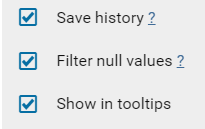
 Additional settingsSave history
Saving sensor history allows you to use sensor data in reports. If you do not save the sensor values, their value will only be available when viewing online information on the object.
Filter null values
The values obtained after the conversion formula and not included in the calibration table will not be taken into account.
Display in tooltips.
|
 SaveSave button.
|
|