Trips and parkings MC
The Trips and Parkings MC report provides information about the movement and parking periods of the selected monitored object. It allows you to reconstruct the sequence of events, determine trip and parking times and durations, view start and end addresses, and calculate mileage and other operating indicators.
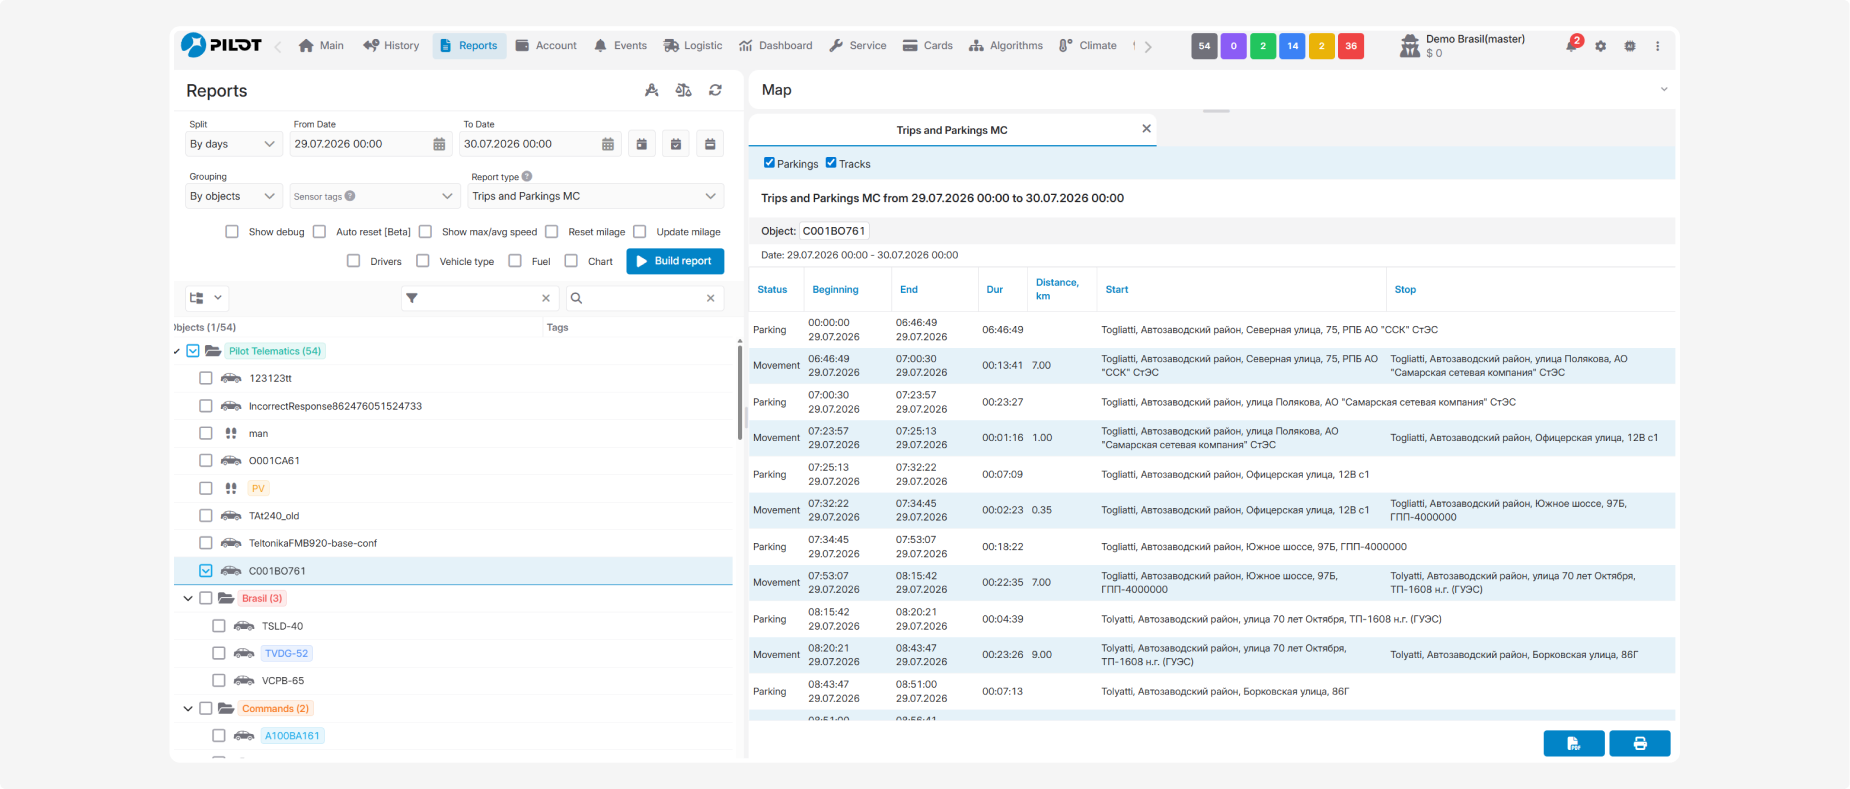
What the report shows
• Status — the object status: Movement or Parking
• Beginning — the date and time when the movement or parking period began
• End — the date and time when the movement or parking period ended
• Dur — the duration of the corresponding event
• Distance, km — the distance traveled by the object during the movement period; no value is displayed for parking events
• Start — the trip start address or parking location
• Stop — the trip end address; this value may not be displayed for parking events
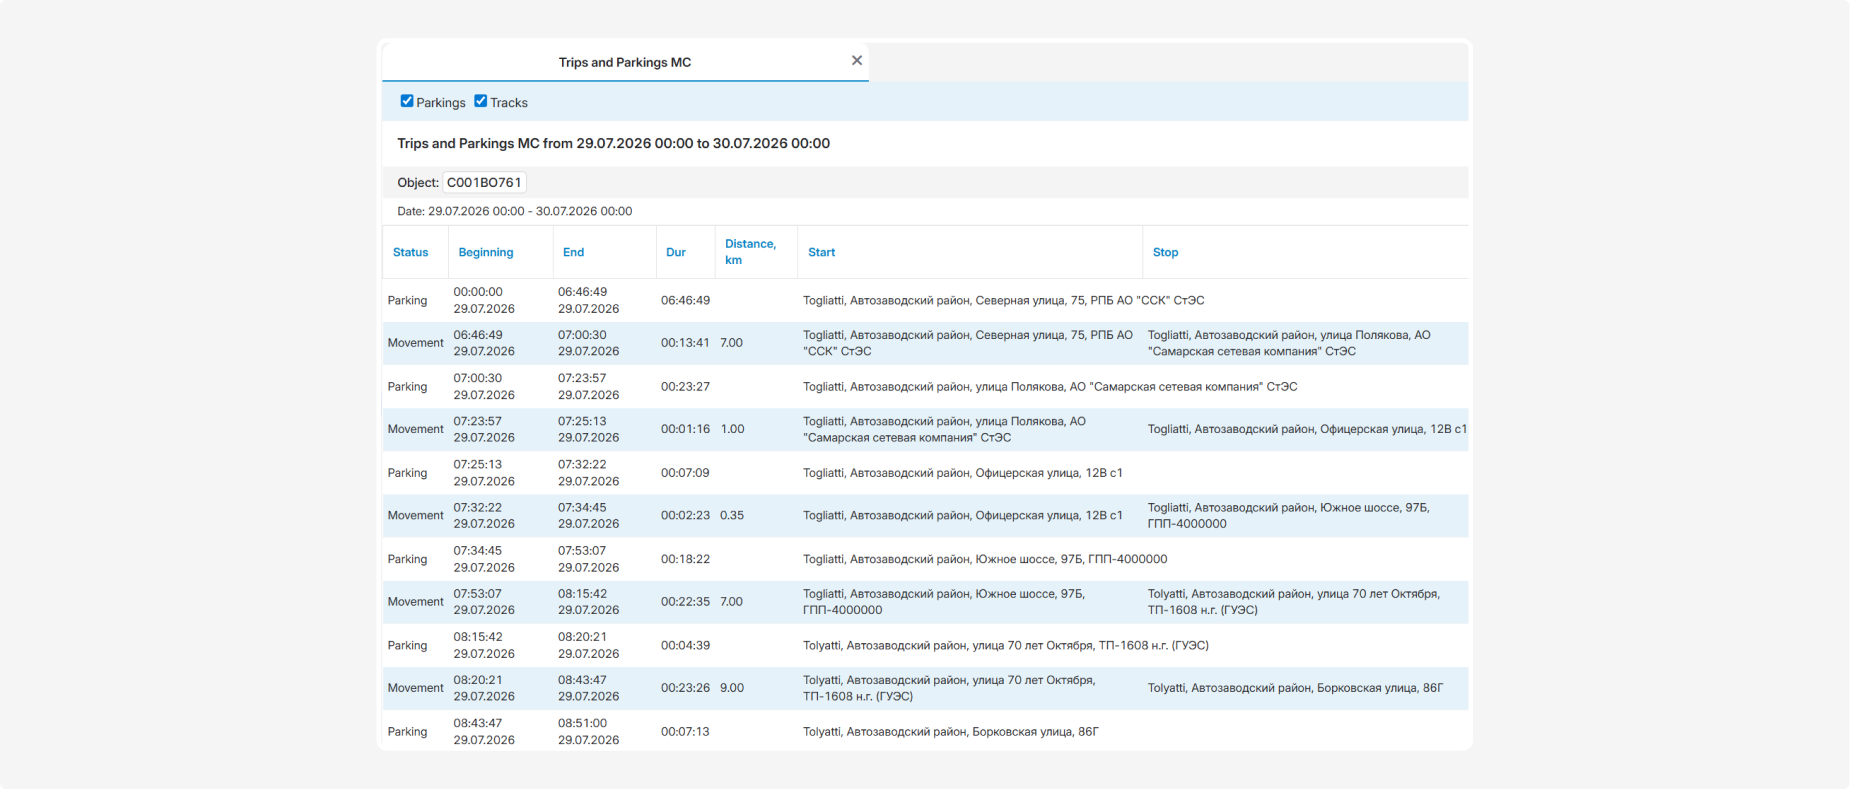
Summary indicators
Summary indicators are displayed below the table, first for the current report block and then for the entire selected period:
• Total odometer — the total distance traveled by the object
• Track Time — the total duration of the generated tracks
• Move Time — the total time during which the object was moving
• Track Parking Time — the duration of parking events included within the tracks
• Parking Time — the total duration of all parking events within the reporting period
• Average Speed — the object’s average movement speed
• Max Speed — the highest recorded speed
The section marked “for period” displays the same indicators calculated using all data included in the report.
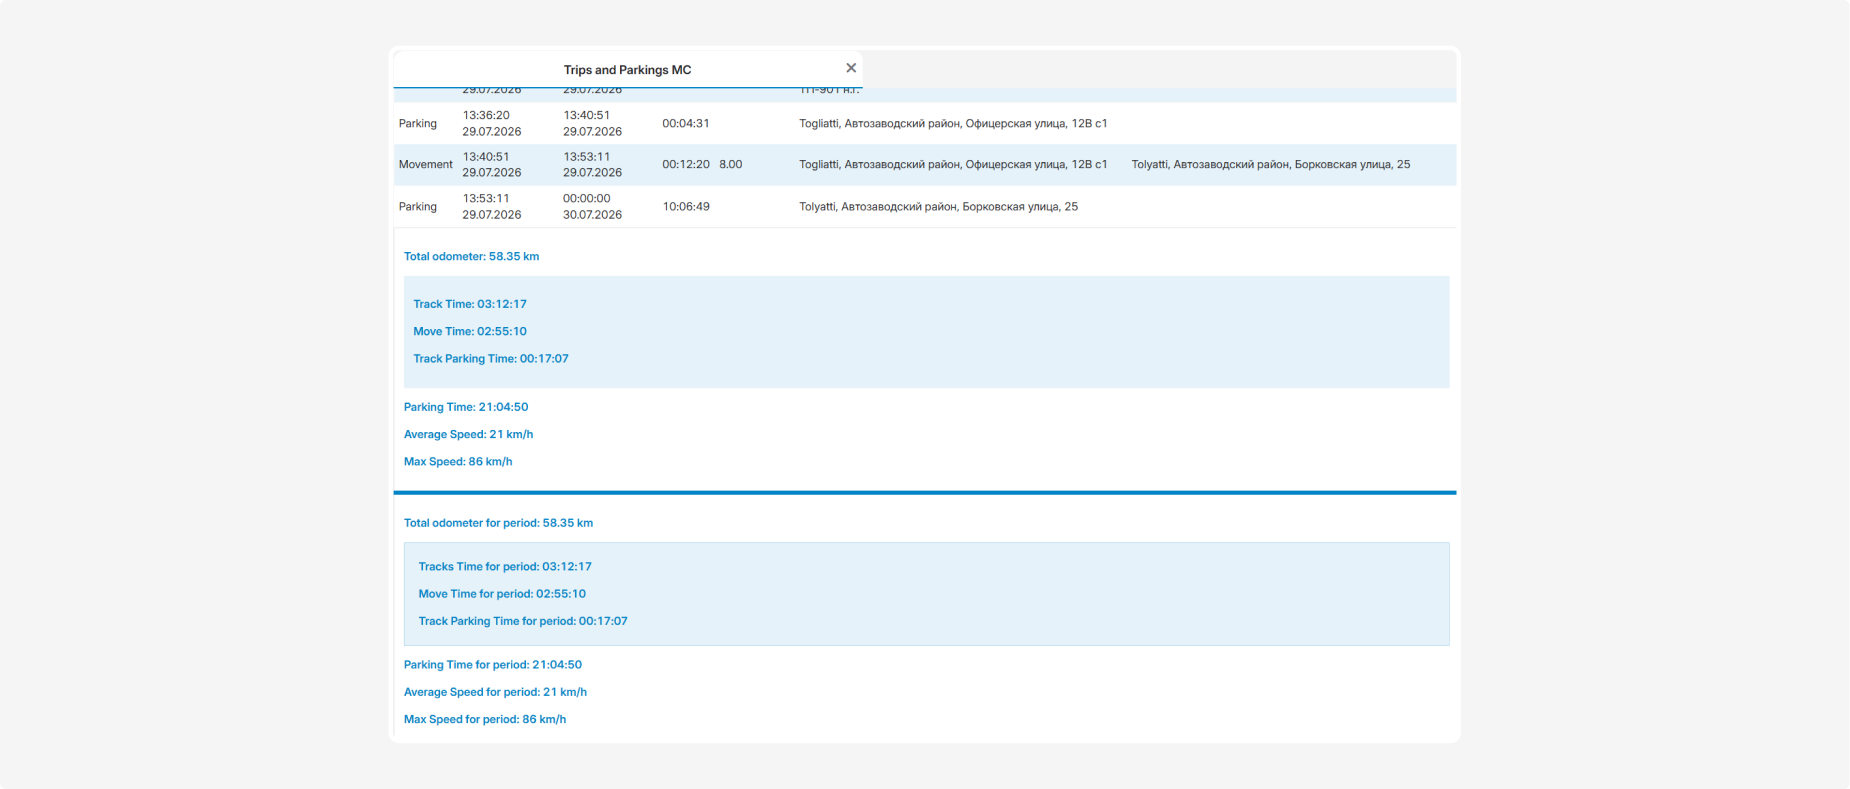
Filtering tracks and parkings
The Parkings and Tracks options are available at the top of the generated report:
• Parkings and Tracks selected — all events are displayed
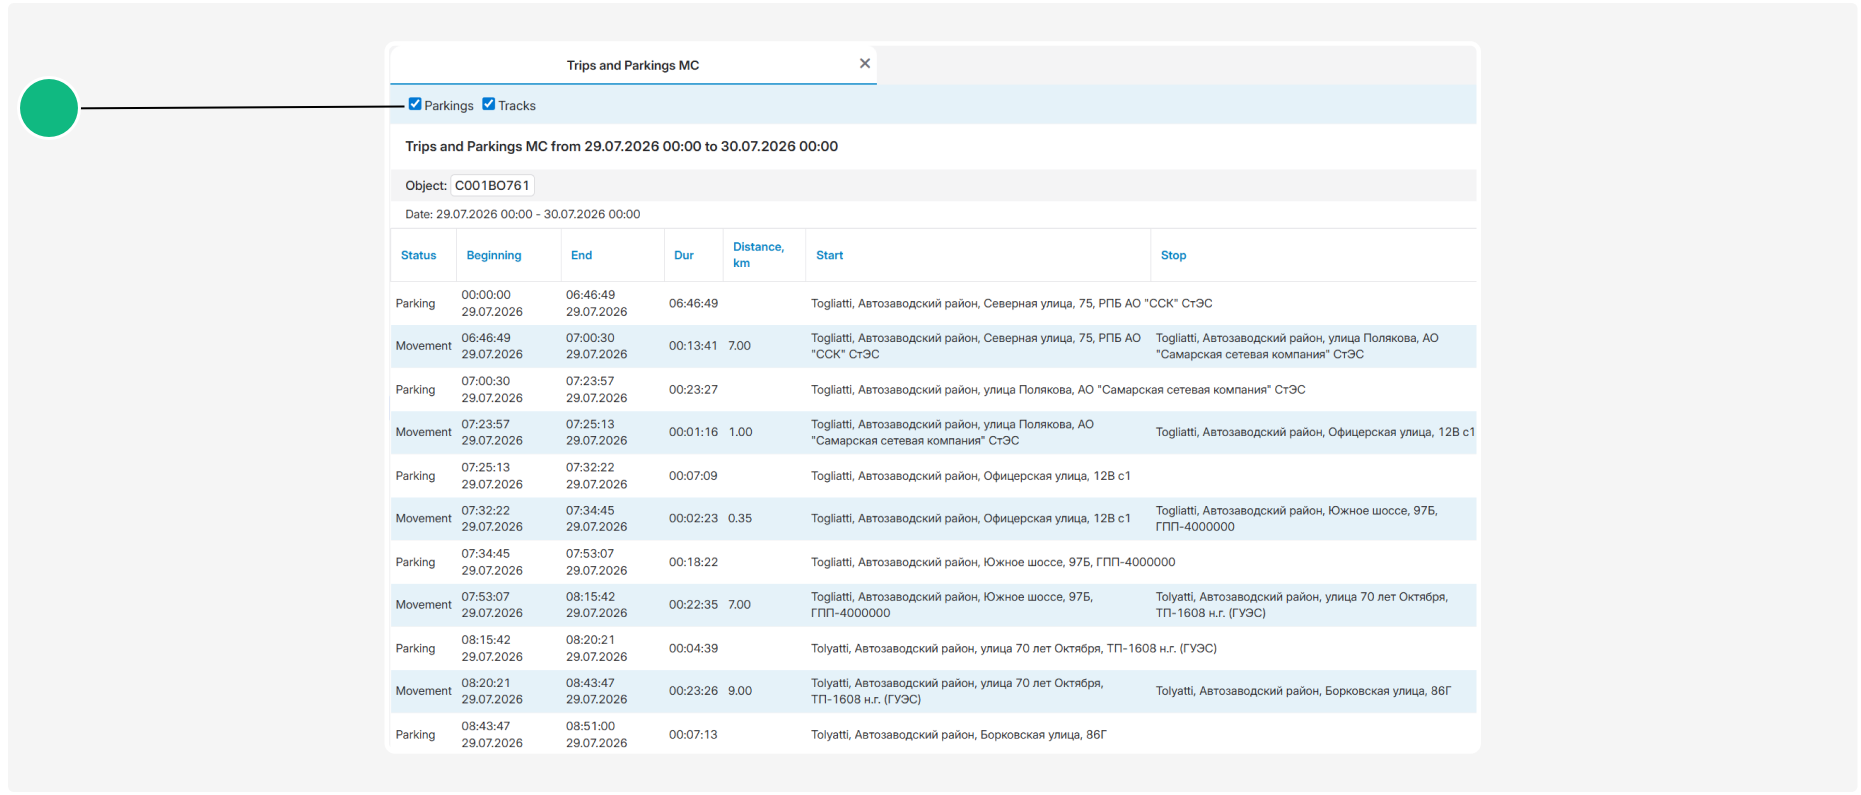
• Tracks selected only — only movement periods are displayed
• Parkings selected only — only parking periods are displayed
These checkboxes allow you to change which rows are displayed without rebuilding the report.
Report parameters
The following additional parameters are available before building the report:
• Show debug
• Auto reset [Beta]
• Show max/avg speed
• Reset milage
• Update milage
• Drivers
• Vehicle type
• Fuel
• Chart

Show debug
The Show debug option is intended for diagnosing trip generation and mileage calculation.
When it is enabled, the Debug menu appears at the top of the generated report.
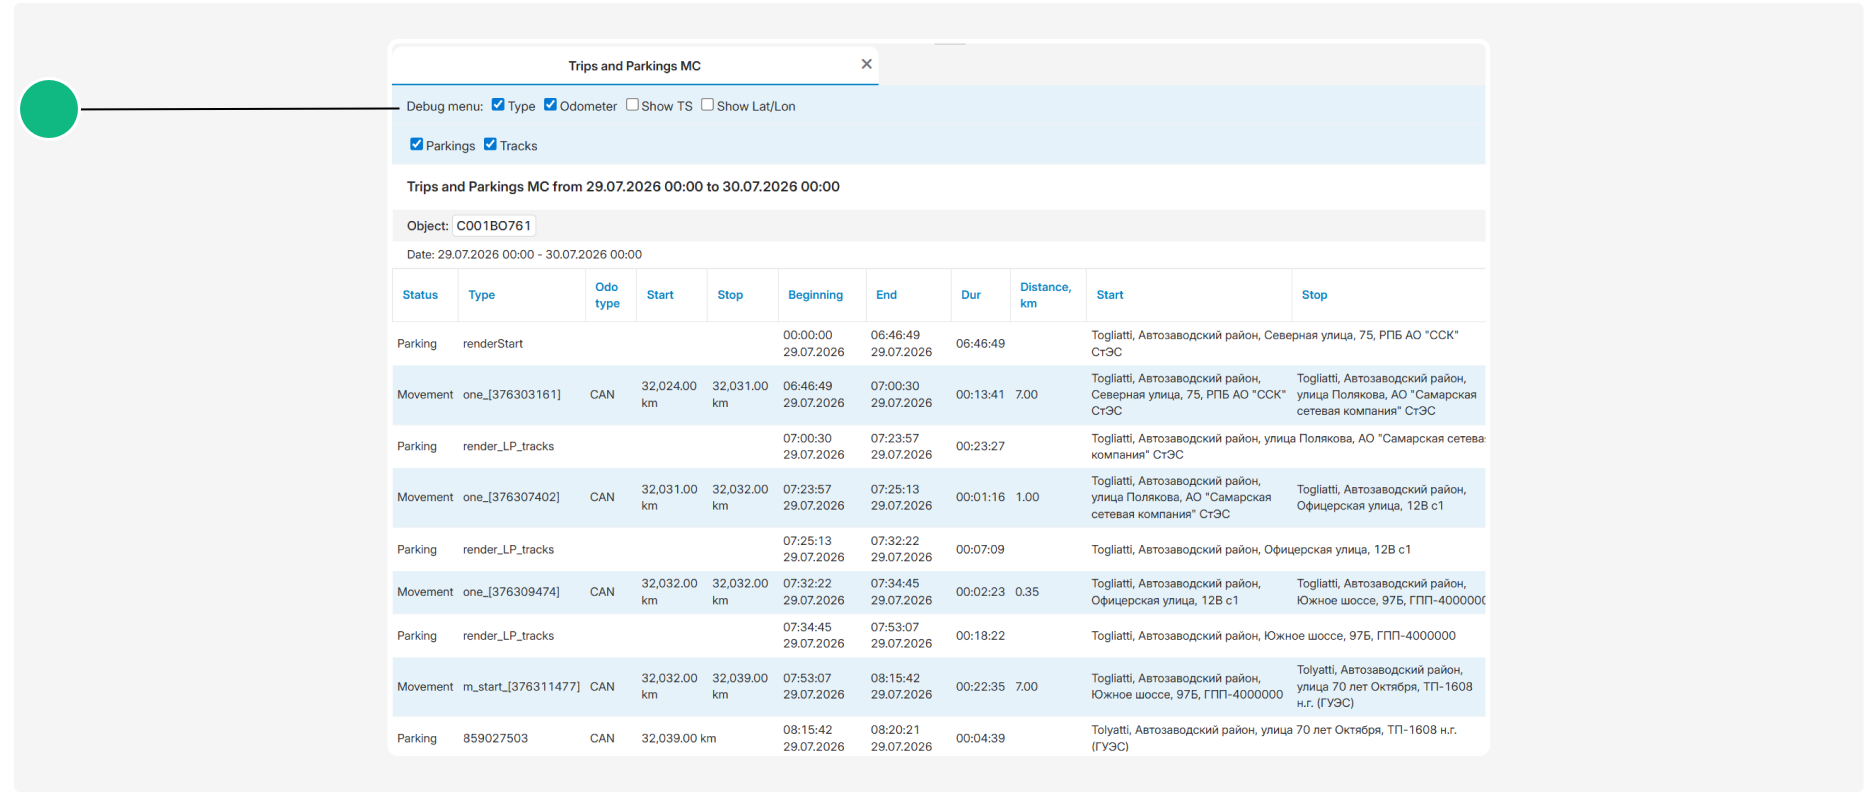
The menu contains the following options:
• Type
• Odometer
• Show TS
• Show Lat/Lon
These options allow you to view the internal data used to generate trips and parkings.

1 — Type
When Type is enabled in the Debug menu, the Type column is added to the table.
It displays the internal event type or identifier used by the system to generate the corresponding row. Examples include:
• renderStart — an event generated at the beginning of the reporting period
• render_LP_tracks — a parking event generated between movement segments
• one_[…], m_start_[…], and m_last_[…] — internal identifiers or methods used to generate movement segments
These values are primarily intended for diagnostics. They help determine which event or processing stage was used to generate a trip or parking period.
2 — Odometer
When Odometer is enabled in the Debug menu, additional columns containing detailed odometer data are added:
• Odo type — the odometer data source or type, such as CAN
• Start — the odometer reading at the beginning of the trip
• Stop — the odometer reading at the end of the trip
These columns allow you to verify which readings were used to calculate the value in the Distance, km column. Odometer readings may be unavailable for parking events.
3 — Show TS
When Show TS is enabled, the Beginning and End columns display numerical timestamps instead of formatted dates and times.
The system uses timestamps to store the exact time of an event. This mode is intended for technical data verification. When Show TS is disabled, values are displayed in the standard date and time format.
4 — Show Lat/Lon
When Show Lat/Lon is enabled, the Start and Stop columns display geographical coordinates instead of addresses:
• lat — latitude
• lon — longitude
For a movement period, the coordinates of the beginning and end of the trip are displayed. For a parking period, the coordinates of the object’s parking location are displayed.
Auto reset [Beta]
The Auto reset [Beta] option is used when calculating mileage from odometer readings. The system attempts to detect odometer resets or breaks in the sequence of readings, such as when a new odometer value is lower than the previous one, and account for them when calculating the distance.
This option does not add a separate column. It affects how odometer readings and mileage are processed. Because the feature is marked Beta, the resulting values should be verified using Show debug → Odometer.
Reset milage
The Reset milage option enables the processing of events associated with odometer resets. It is used to prevent an incorrect difference between readings recorded before and after a detected reset.
The option affects the Distance, km values and total mileage but does not add any columns. Use Show debug → Odometer to compare the starting and ending odometer readings.
Update milage
The Update milage option includes updated odometer readings when generating the report. It affects the odometer values used by the system and the calculated distance.
The results can be seen in:
• the starting and ending odometer readings
• the distance calculated for individual trips
• the total mileage
The exact effect of Auto reset [Beta], Reset milage, and Update milage depends on the sequence of incoming odometer readings and the mileage source settings.
Show max/avg speed
When Show max/avg speed is enabled, the following columns are added to the right side of the table:
• Max speed — the highest speed recorded during the trip
• Avg speed — the object’s average speed during the trip

Drivers
When Drivers is enabled, the Driver column is added to the table.
It displays the driver assigned to the object during the corresponding trip or parking period. If no driver was assigned or the data was unavailable, the cell may remain blank.
Vehicle type
When Vehicle type is enabled, the Vehicle type column is added to the table. It displays the vehicle category or type specified in the monitored object settings.

Fuel
When Fuel is enabled, the following additional indicators are displayed in the summary section:
• Total consumption, l/100km — the calculated fuel consumption
• Balance at the beginning, L — the amount of fuel at the beginning of the reporting period
• Balance at the end, L — the amount of fuel at the end of the reporting period
• Total consumption for period — the total calculated fuel consumption for the entire selected period
The availability and accuracy of these values depend on the presence and configuration of a fuel level sensor.

Chart
When Chart is enabled, a timeline showing the sequence of events appears above the table:
• Parking — periods when the object was not moving
• Moving — periods when the object was moving
• Horizontal axis — the date and time within the reporting period
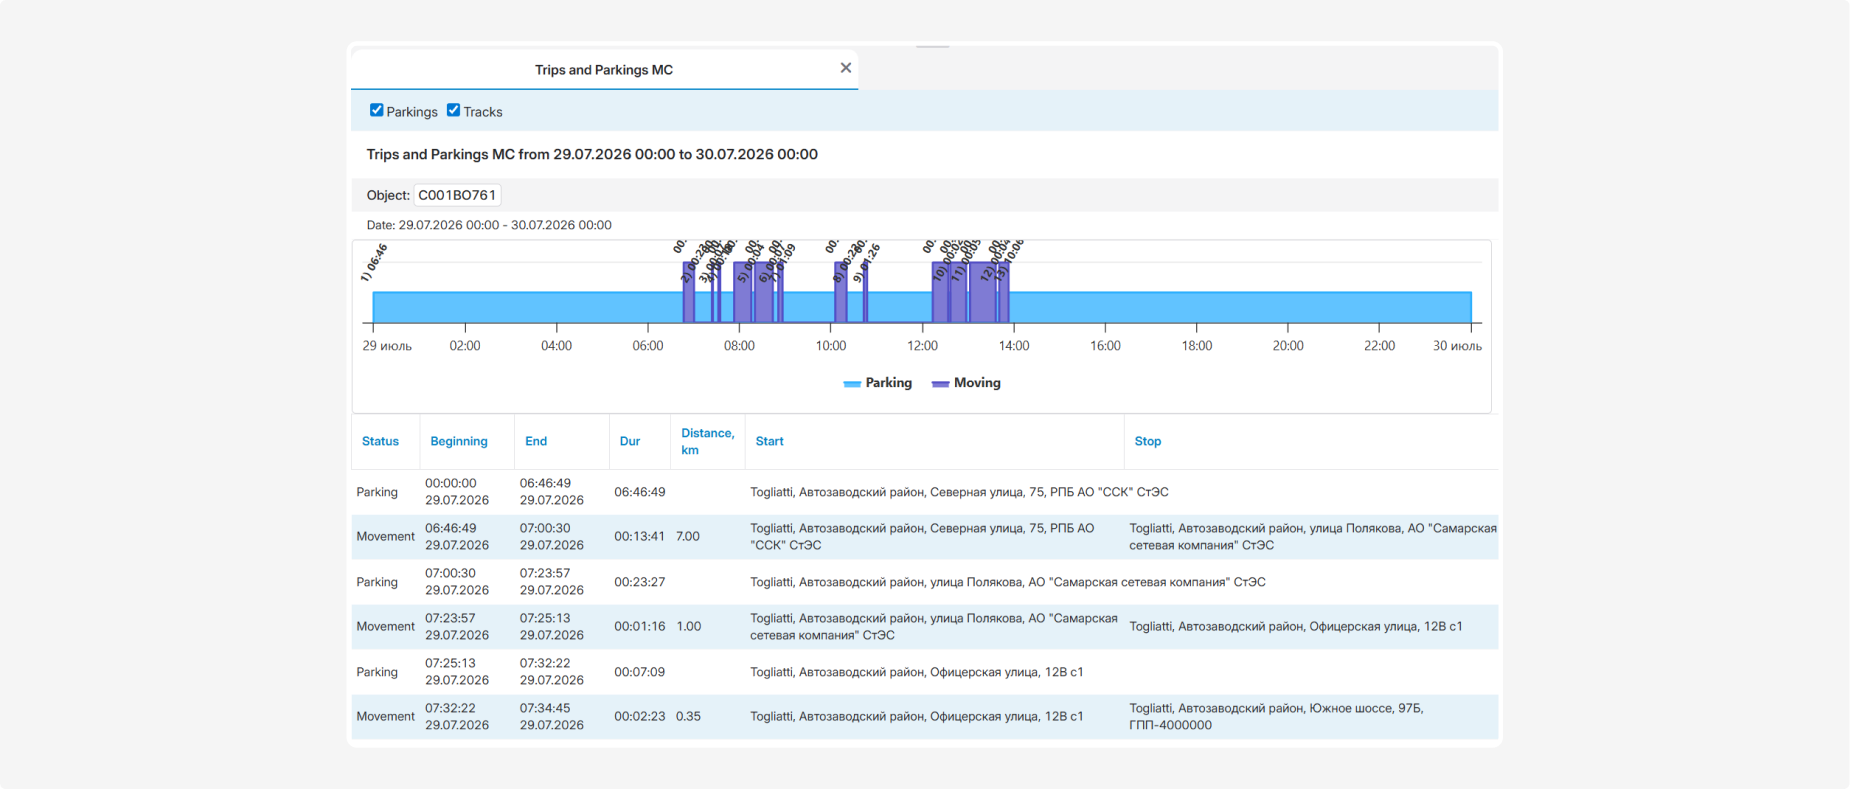
The Chart allows you to visually compare trip and parking durations, determine when each movement period began, and identify extended periods without movement.