Trips and parkings
The Trips and parkings report provides information about the movement and parking periods of the selected monitored objects. It allows you to determine when and where a vehicle started and stopped moving, how long it was moving or parked, the distance traveled, and its speed.
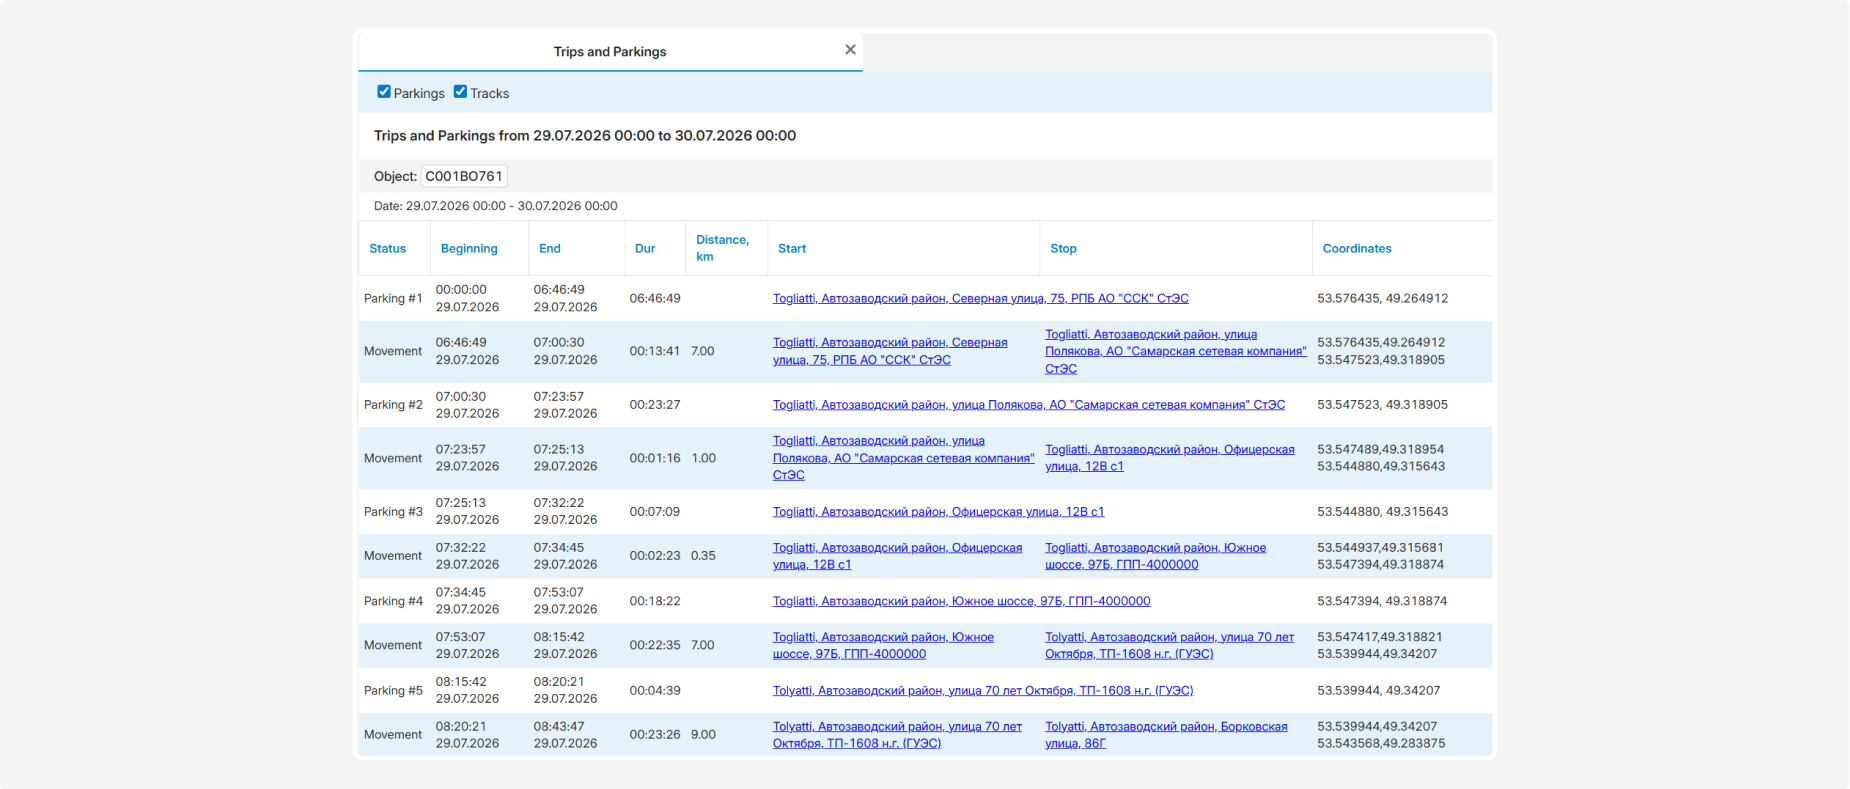
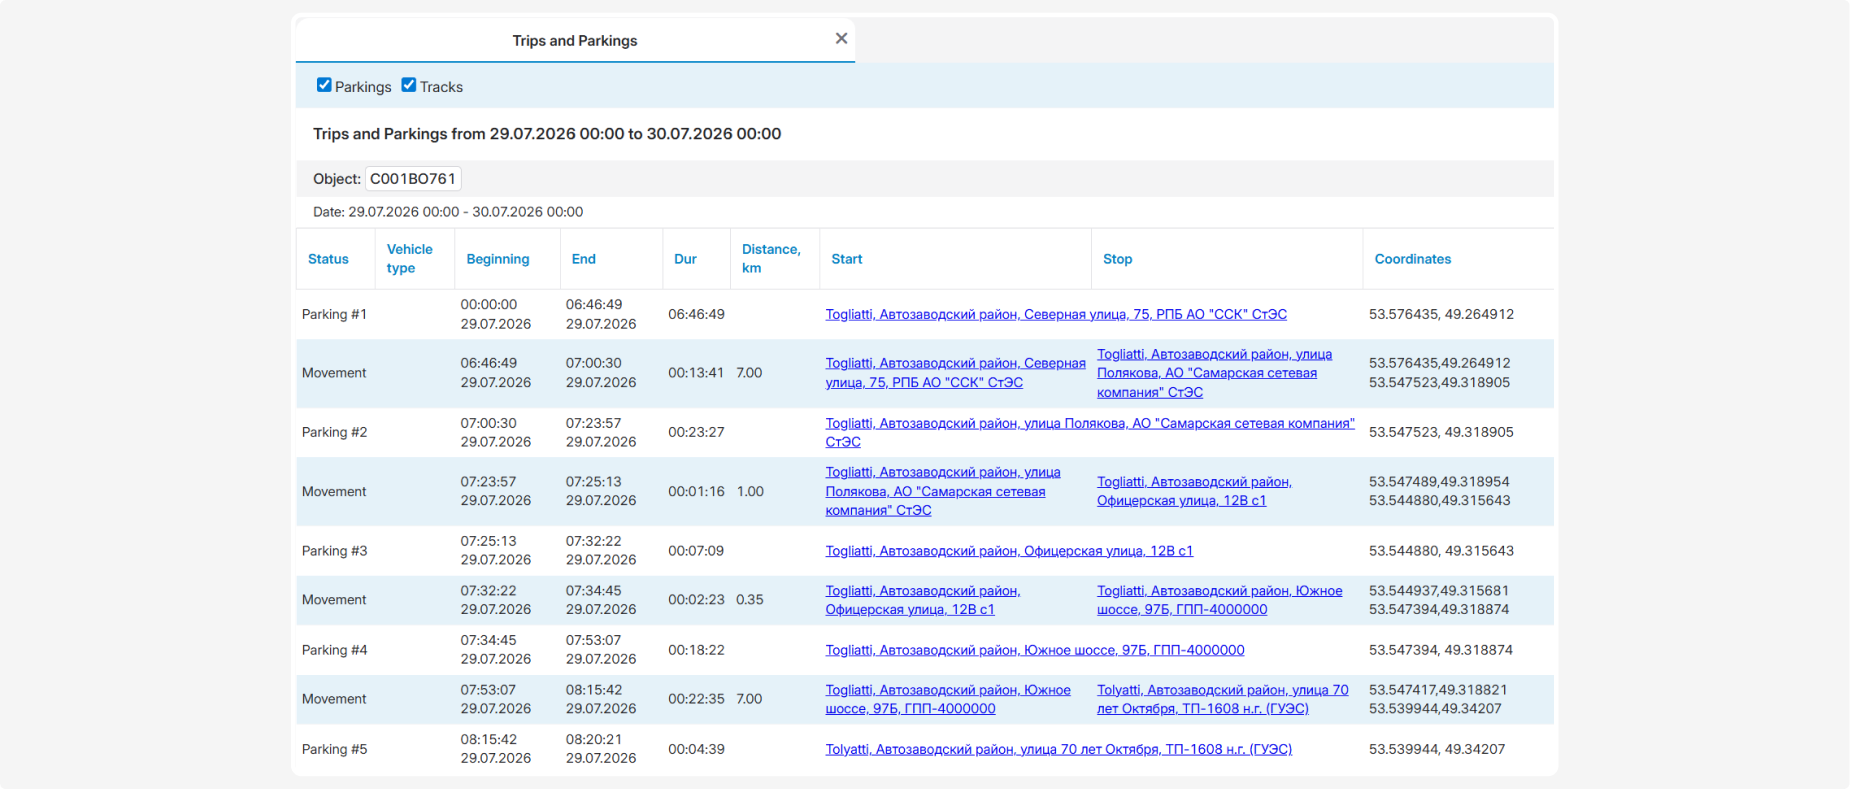
Events are displayed in chronological order. Each row represents a separate movement or parking period. The monitored object and reporting period are shown at the top of the report.

What the report shows
• Status — the object status: Movement or Parking; each parking event is also assigned a sequence number
• Beginning — the date and time when the movement or parking period began
• End — the date and time when the movement or parking period ended
• Dur — the duration of the corresponding movement or parking period
• Distance, km — the distance traveled by the object during the movement period; no value is displayed for parking events
• Start — the address where the movement began or the parking location
• Stop — the address where the movement ended; this value may not be displayed for parking events
• Coordinates — the geographical coordinates of the beginning and end of the movement or the parking location
The addresses in the Start and Stop columns are displayed as links and allow you to open the corresponding location.
Summary indicators
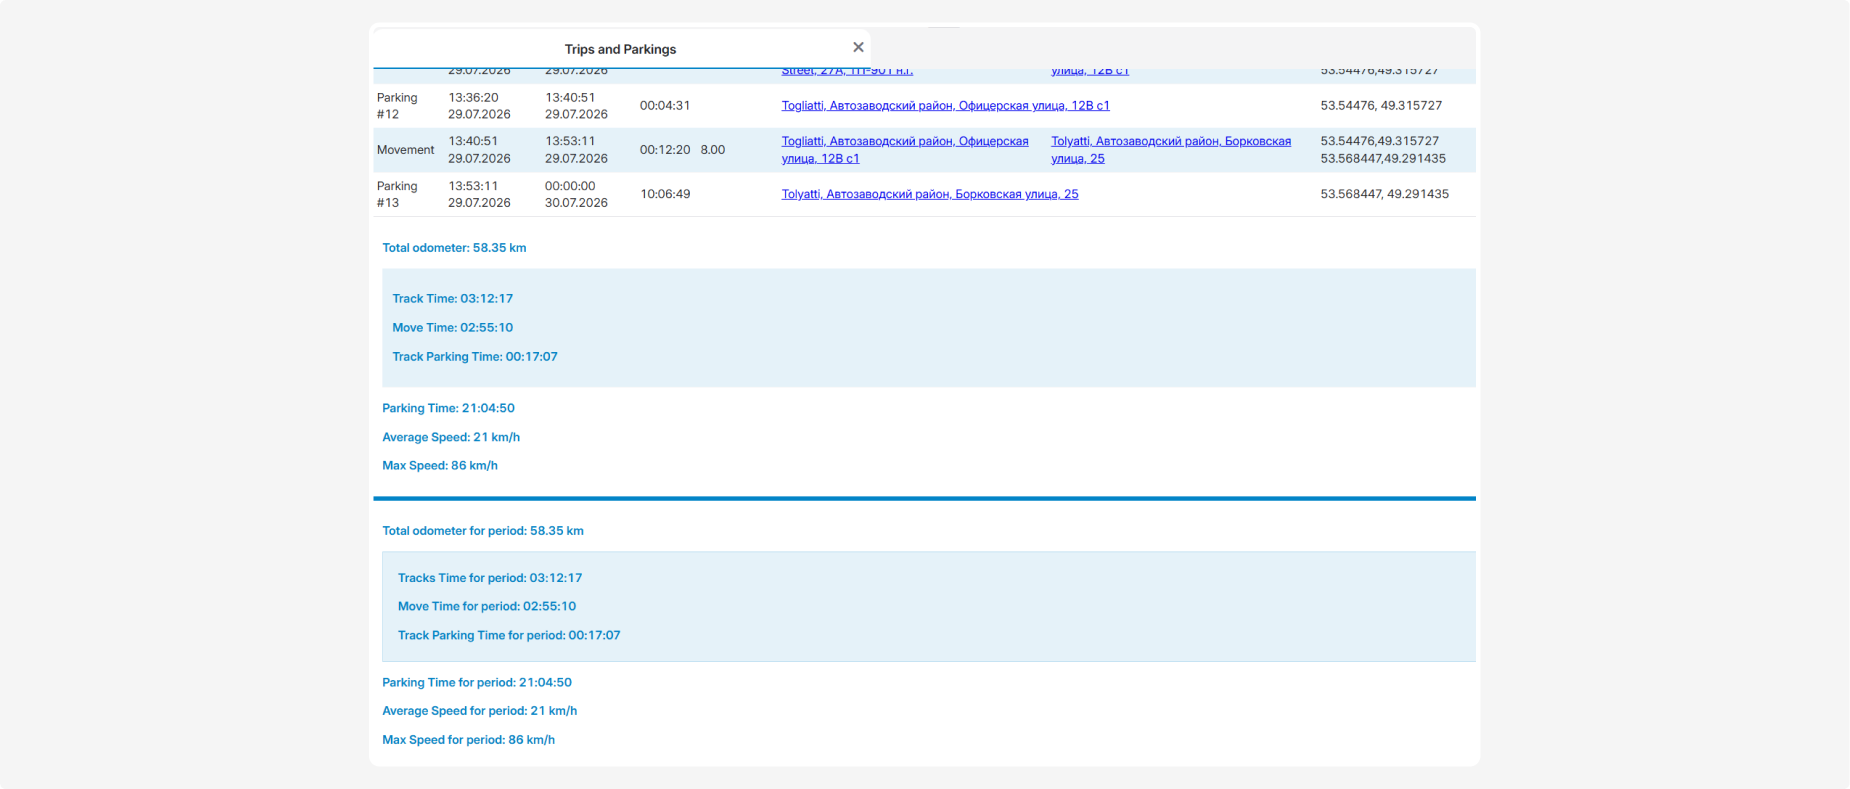
The bottom section of the report displays summary indicators for the current data block, such as one object for one day:
• Total odometer — the total distance traveled by the object within the current report block
• Track Time — the total duration of the recorded tracks, including movement time and parking time within the tracks
• Move Time — the total time during which the object was moving
• Track Parking Time — the total duration of parking events recorded within the tracks; together with Move Time, it forms Track Time
• Parking Time — the total time the object was parked, including parking periods before the first trip, between trips, and after the last trip within the reporting interval
• Average Speed — the object’s average speed while moving
• Max Speed — the highest speed recorded while the object was moving
Indicators for the entire reporting period
Below the separator, the report displays the same indicators calculated across all data blocks for the entire selected period:
• Total odometer for period — the total distance traveled by the object during the selected period
• Tracks Time for period — the total duration of all recorded tracks during the selected period, including movement time and parking time within the tracks
• Move Time for period — the total time the object was moving during the selected period
• Track Parking Time for period — the total duration of parking events recorded within the tracks during the selected period
• Parking Time for period — the total time the object was parked within the boundaries of the selected period
• Average Speed for period — the object’s average speed during the selected period
• Max Speed for period — the highest speed recorded during the selected period
How parking time is calculated
The report covers the entire selected time interval, including periods before the first movement and after the last movement:
• If the vehicle was not moving at the beginning of the reporting period, the system adds a parking event from the beginning of the period until the first recorded movement
• If the object remained stationary after its last movement, the parking event is displayed until the end of the reporting period
• If the selected reporting period ends in the future, the last parking event is displayed up to the current time
This ensures that the report includes both trips and the intervals between them, providing a continuous sequence of events throughout the analyzed period.
Filtering tracks and parkings
The Parkings and Tracks options are available at the top of the generated report.
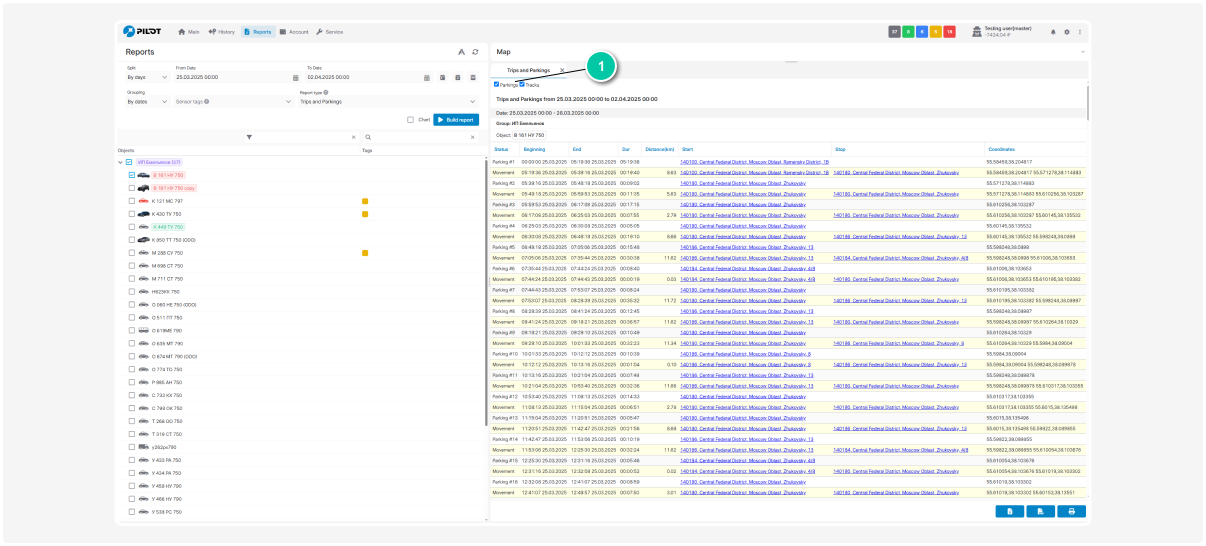
They allow you to change which rows are displayed without selecting the reporting period again:
• Parkings and Tracks selected — all events are displayed
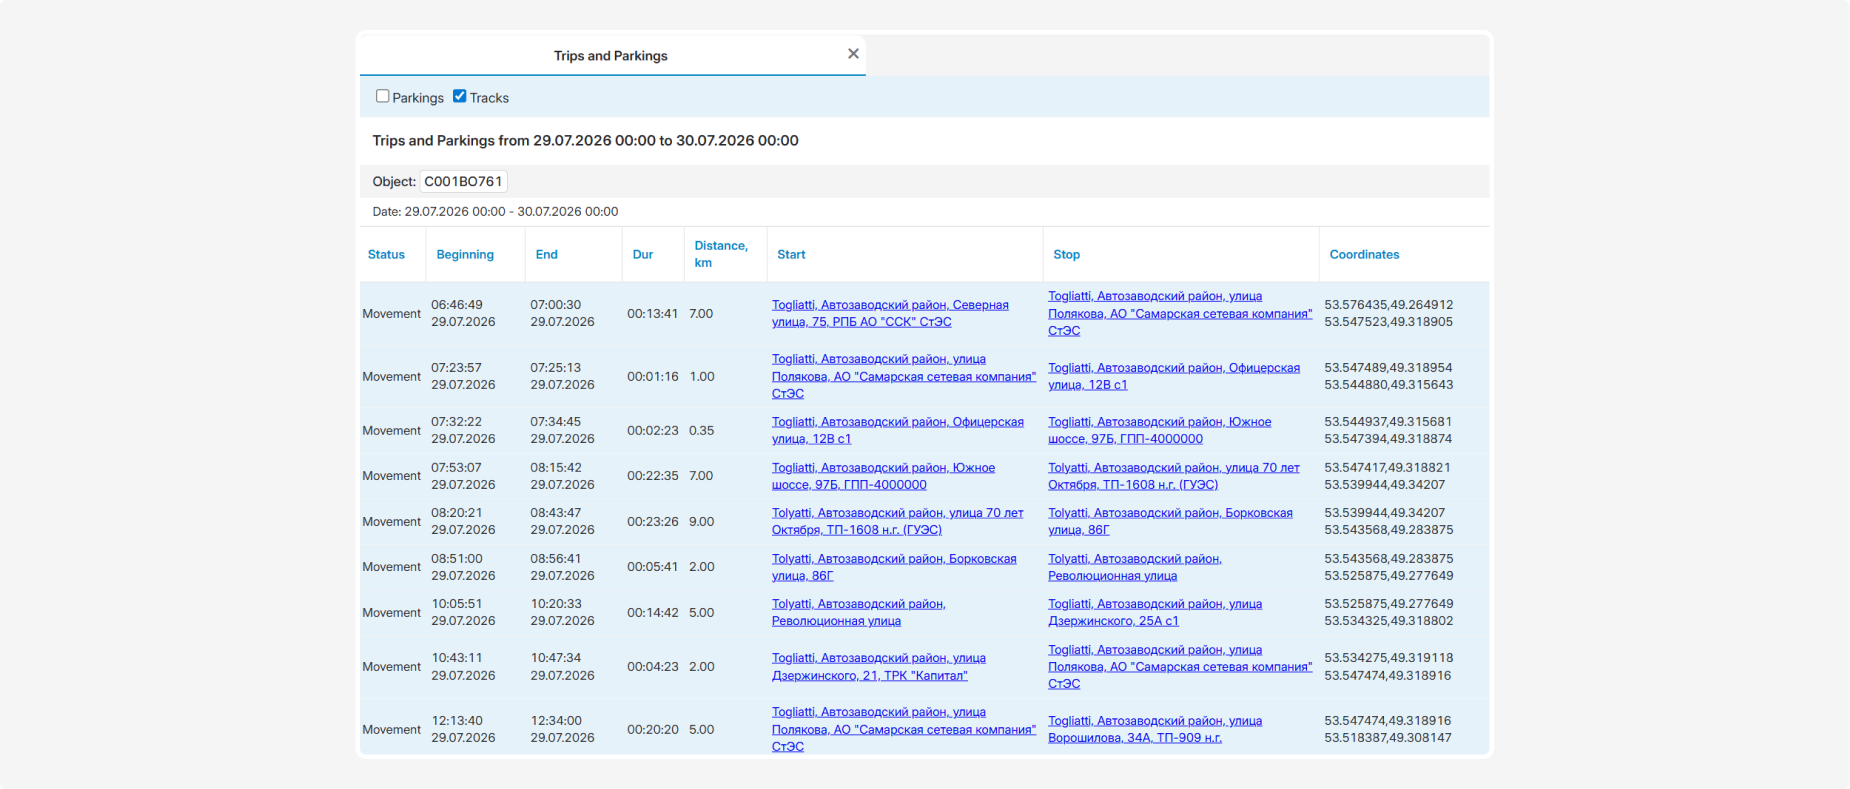
• Tracks selected only — only movement periods are displayed
• Parkings selected only — only parking periods are displayed

Select or clear the corresponding checkbox to show or hide an event type.
Report parameters
Before building the report, you can configure the following additional parameters:

• Drivers — adds the Driver column containing information about the driver assigned to the object during the event

• Vehicle type — adds the Vehicle type column containing the vehicle category
• Chart — adds a graphical representation of movement and parking periods to the report
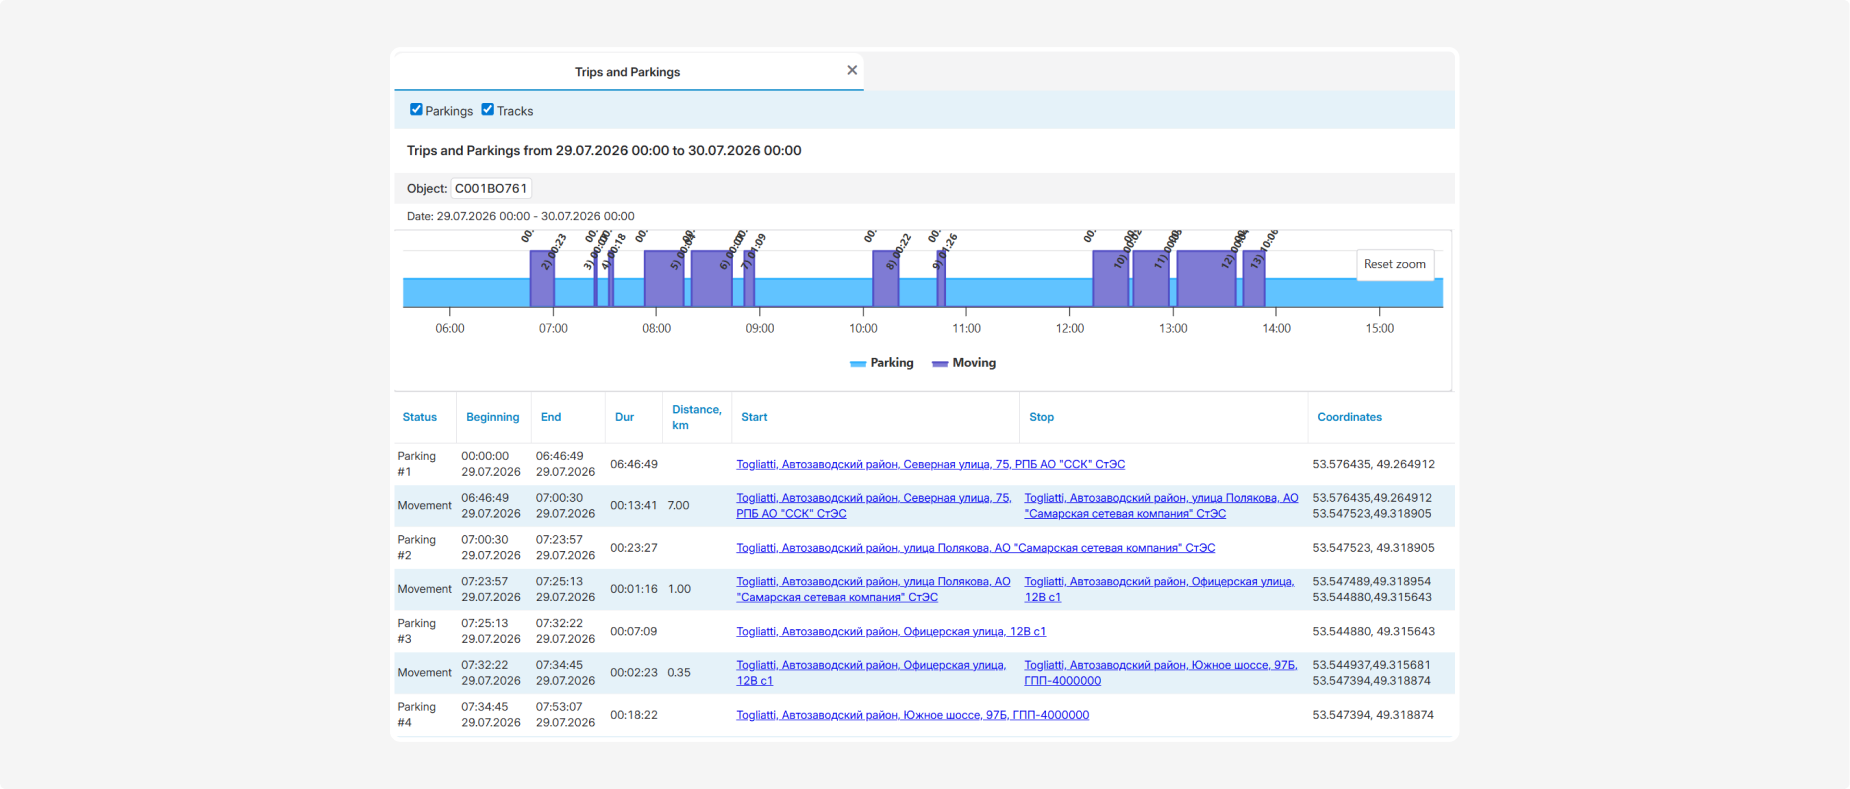
The chart appears above the report table and displays the sequence of events on a timeline:
• Parking — periods when the object was stationary
• Moving — periods when the object was moving
The chart allows you to visually compare the duration of movement and parking periods and identify transitions between the two states. You can zoom in on a selected section of the timeline for a more detailed view. Click Reset zoom to restore the original chart scale.