Working with sensors
In PILOT, you add and configure sensors through a dedicated window.
Before adding a sensor, make sure that the device actually sends the specified parameter.
If you add a sensor with a parameter that the device does not transmit, the sensor will not work.
|
-
Open the object menu. To do this, right-click the object in the list
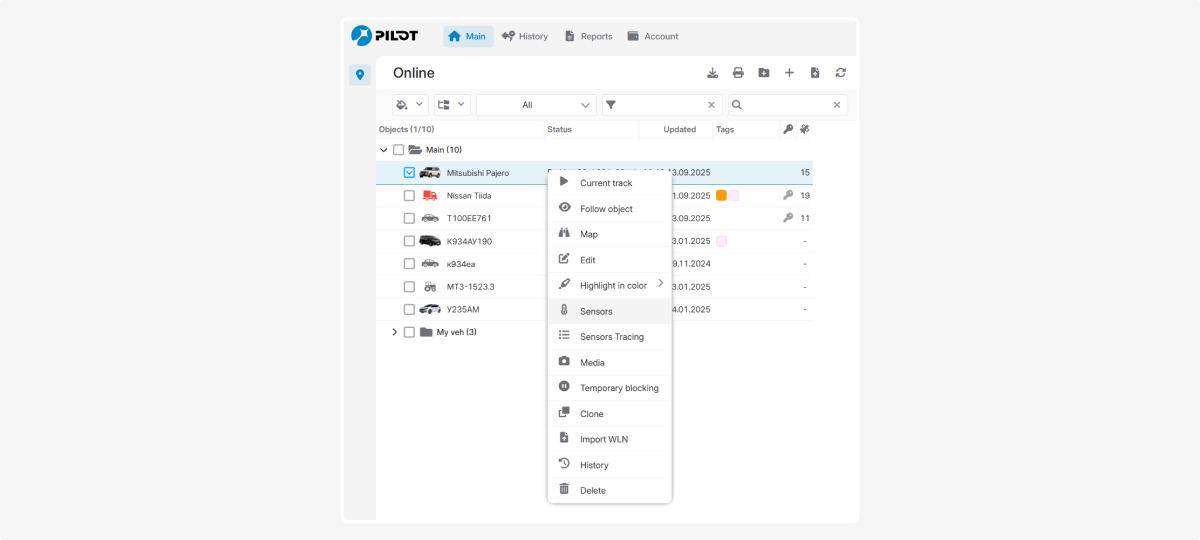
2. In the object menu, select the Sensors tab
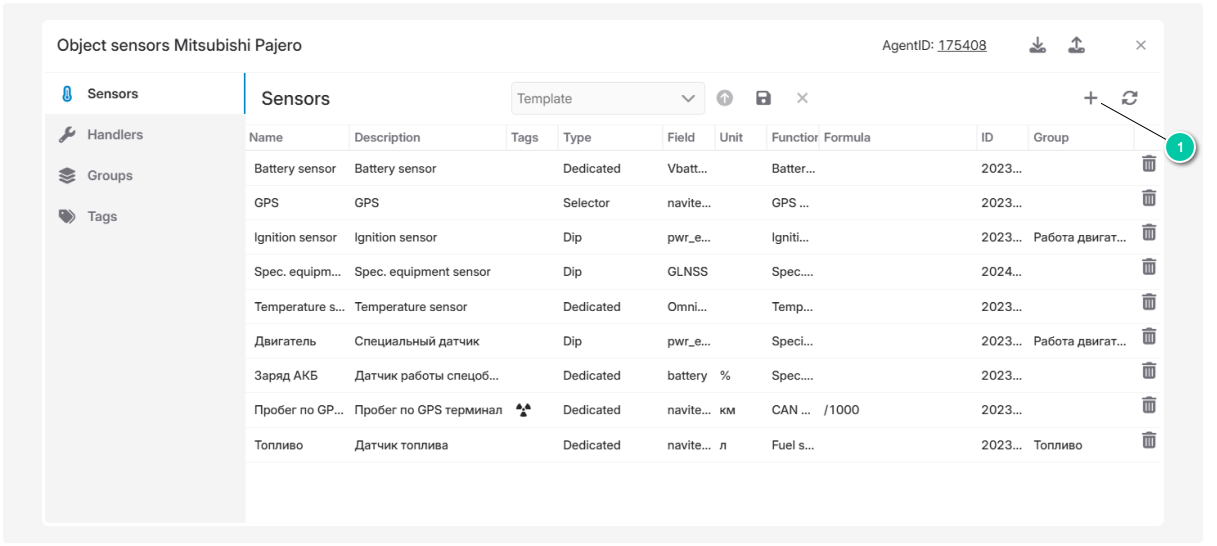
3. In the opened window, go to the Sensors tab and click the button to add a new sensor
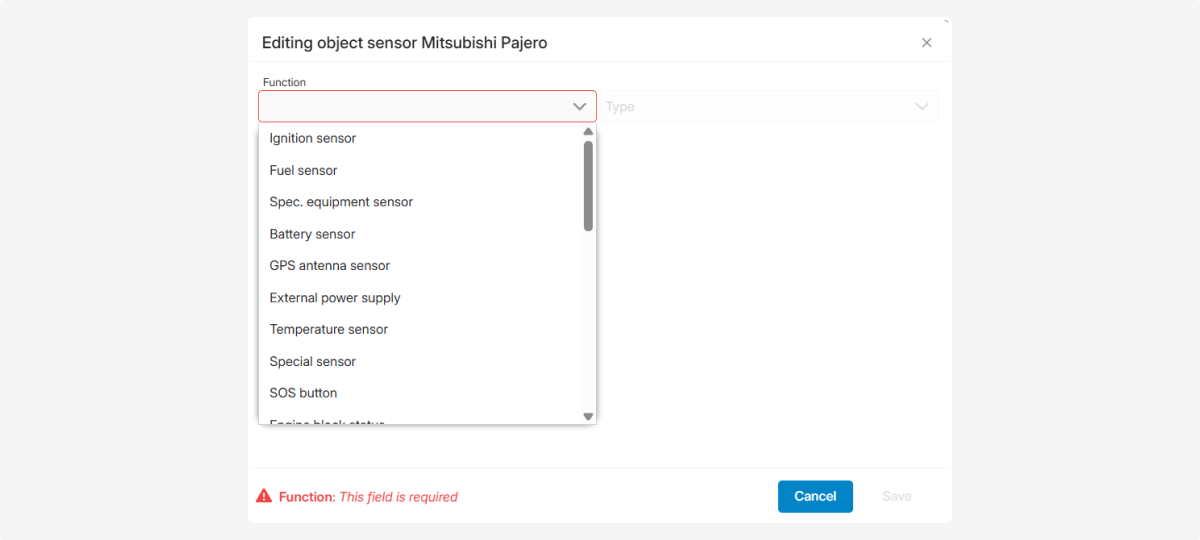
4. In the pop-up window, select the sensor type by its purpose. For example, a battery charge sensor
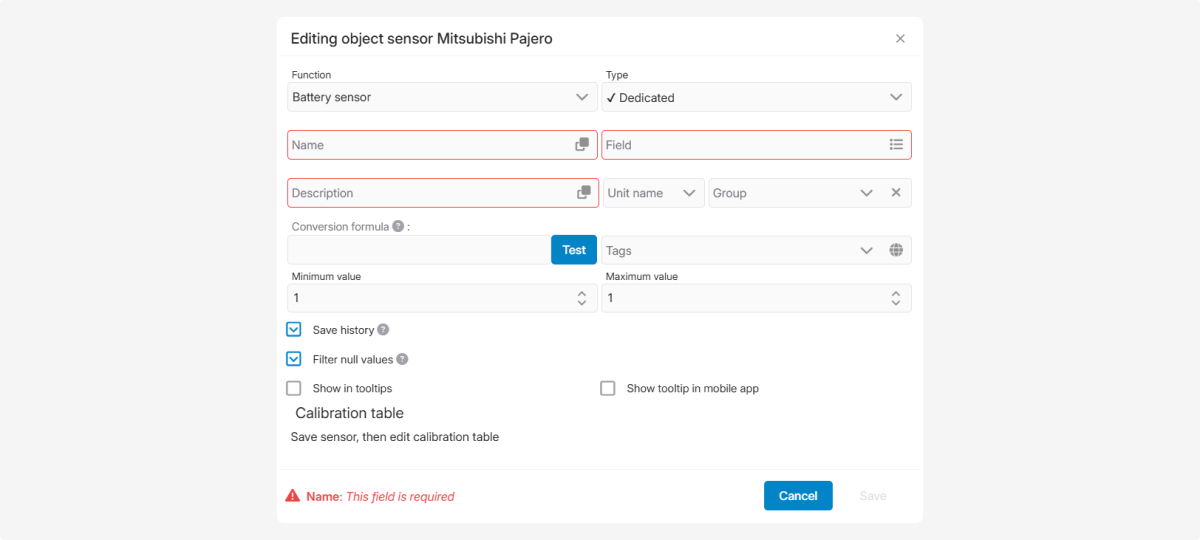
5. Fill in the required fields — enter the sensor name, description, and select the field where the device sends the data values. Configure other necessary parameters
6. Click Save. Check that the sensor appears in the list of active sensors
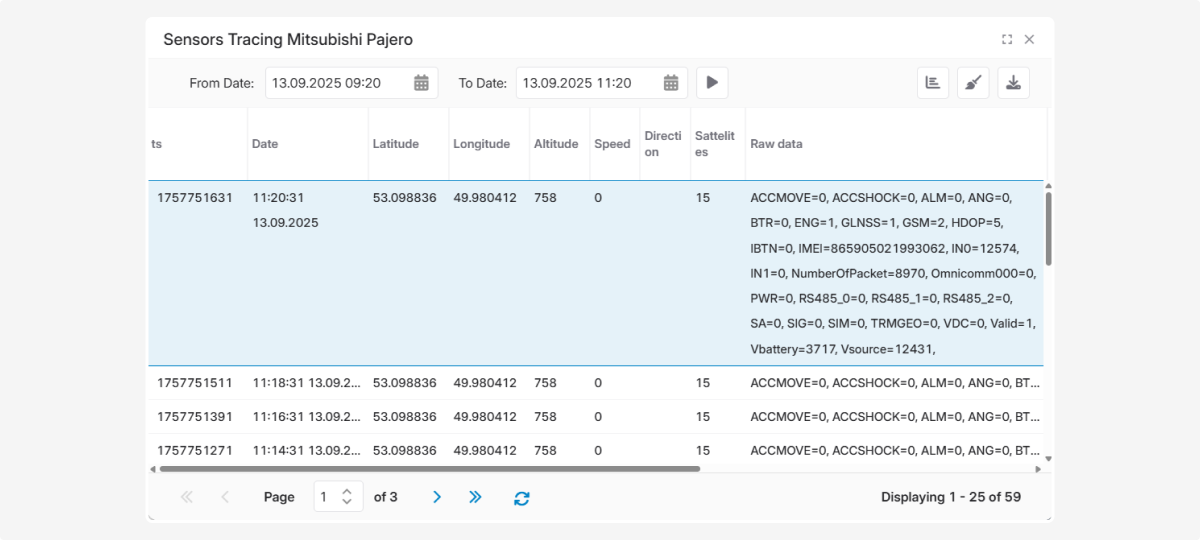
How to check if the sensor is working properly
1. Open the object menu
2. Go to the Sensors tracing tab
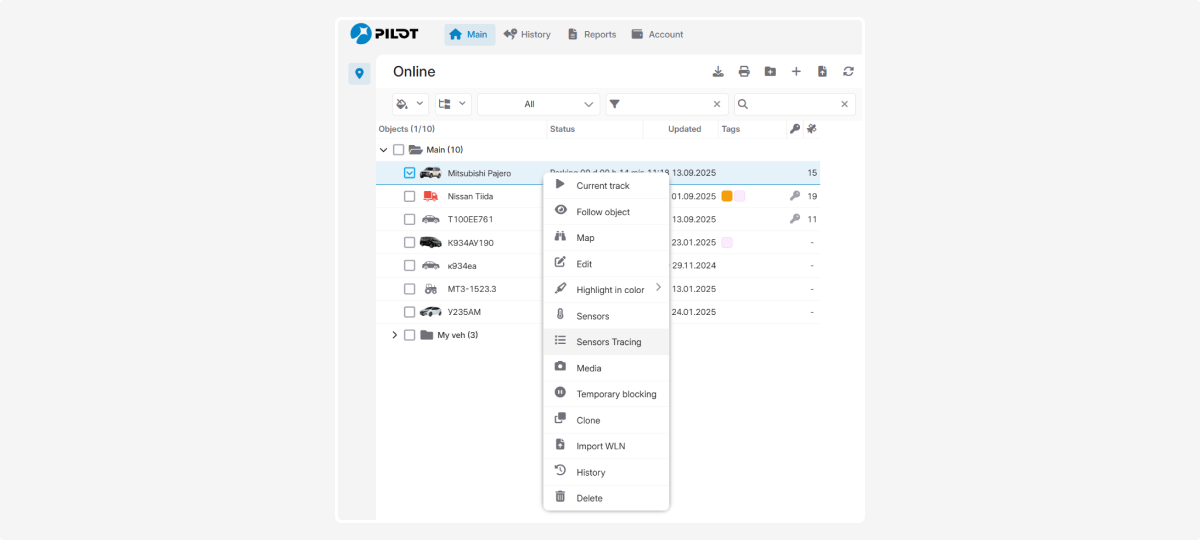
3. Here you will see the values transmitted by all sensors
Watch the video “How to add a new sensor” to quickly learn how to add and configure a new sensor in the PILOT system.
|
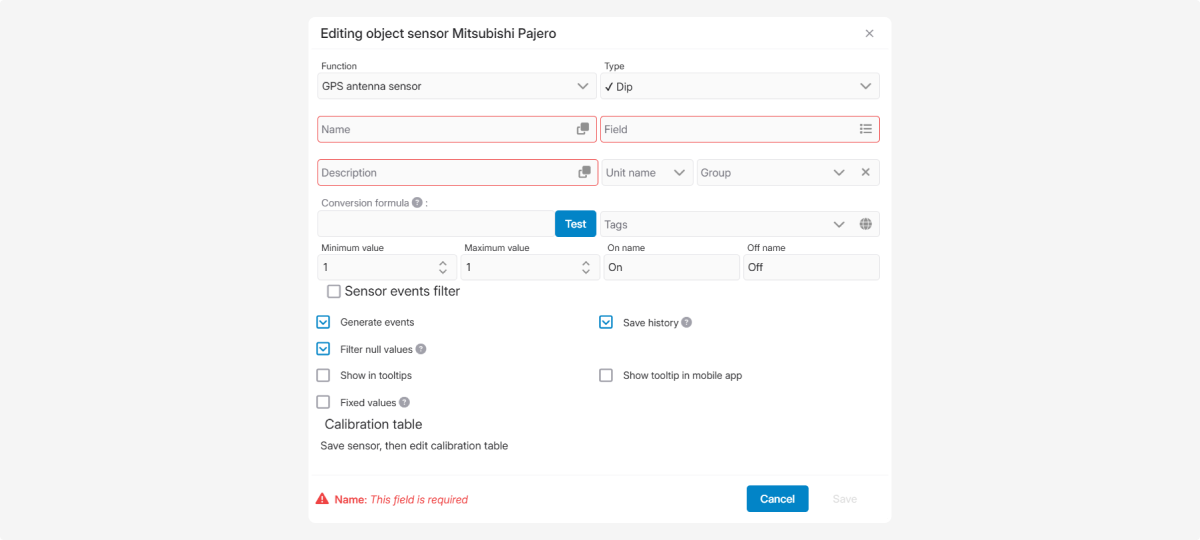
Sensor parameters window
When adding or editing a sensor, the sensor parameters window opens.
To open this window for editing, double-click the sensor in the list.
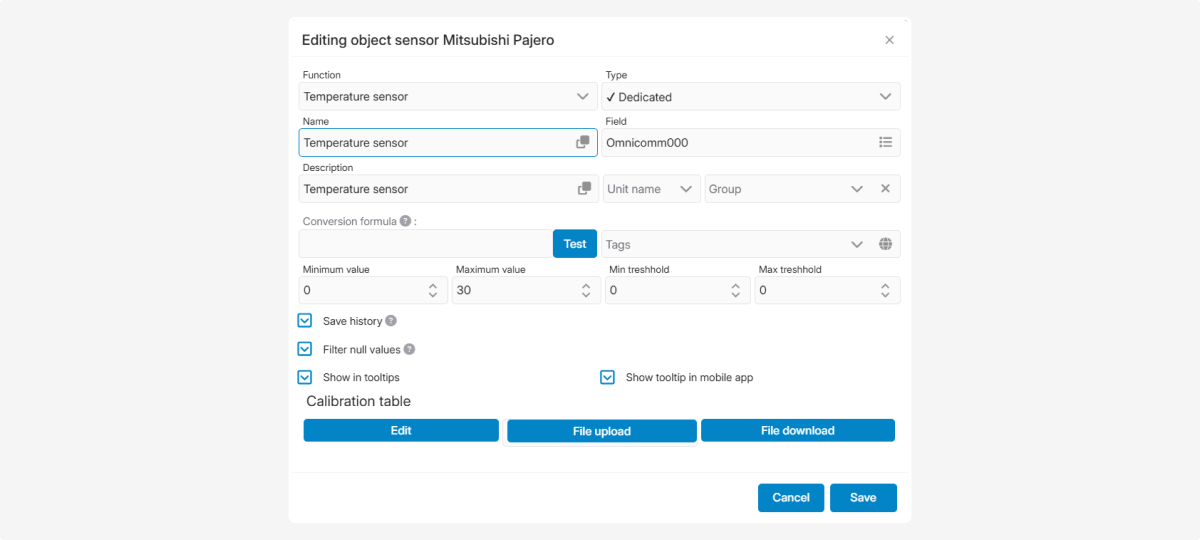
In the sensor parameters window, you fill in the following fields:
|
Field
|
Description
|
|
Function
|
Select the sensor’s purpose from the dropdown list
|
|
Type
|
The sensor type (e.g., binary, pulse, discrete). The system automatically sets the type when you choose the funcrion
|
|
Name
|
Required field. Enter the name to distinguish the sensor in the system. Use the copy-icon
If you have multiple similar sensors, give them unique names
|
|
Description
|
Required field. Enter a description. Use the copy-icon for quick filling
|
|
Field
|
Required field. Select the field from the dropdown that contains the values for this sensor
|
|
Unit of measurement
|
Define the units for displaying sensor values (liters, kilometers, etc.)
|
|
Group
|
Select a sensor group. See how to create sensor groups here
|
|
Conversion formula
|
Apply a formula to recalculate raw data into adjusted sensor readings
|
|
Tags
|
Assign a tag to the sensor. See how to create tags here
|
|
Min/Max value
|
Set acceptable ranges of values. Helps filter out incorrect readings
|
|
Min/Max threshold
|
Define the working range for the sensor. If values go outside, the system logs a deviation
|
|
On/Off names
|
Define labels for the ON and OFF states
|
You can also enable extra options:
|
Option
|
Description
|
|
Sensor event filter
|
Prevents false triggers caused by short-term noise. You can set how many data packets or seconds are required before the system confirms a state change. Example: set 3 → the system confirms ON/OFF only after 3 consecutive packets with the signal.
|
|
Cenerate events
|
Each sensor state change creates a record in the event log
|
|
Filter null values
|
Filters out invalid values. Filters out invalid values. Incoming data is transformed by formula and compared to the calibration table. Out-of-range values are ignored
|
|
Show in tooltips
|
Displays sensor values in object tooltips
|
|
Fixed values
|
Define specific numeric values for ON/OFF instead of ranges. Example: ON = 38, OFF = 37. Other values are ignored
|
|
Save history
|
If enabled, sensor values are saved to reports. Otherwise, only current values are available
|
|
Count engine hours
|
Tracks engine or equipment runtime based on sensor data
|
|
Show tooltip in mobile app
|
If enabled, the sensor values are visible on smartphones. If disabled — hidden in the mobile version
|
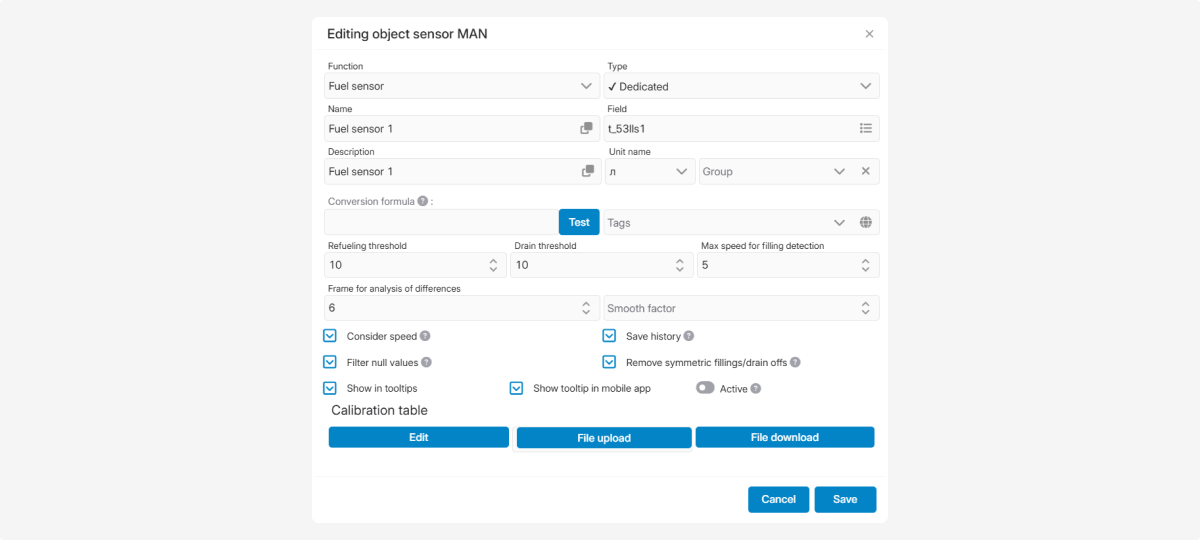
Additional settings for some sensors:
|
Frame for analysis of differences
|
For temperature sensors, defines how many consecutive measurements must exceed the threshold before the system confirms it. Helps avoid false alerts.
|
|
Smooth factor
|
Improves accuracy by removing spikes. The system takes values before/after a measurement, discards extremes, averages the rest, and replaces the original reading.
Example: n = 3 → takes 3 points on each side for averaging. The higher the n, the stronger the smoothing
|
|
Temperature range
|
Defines acceptable temperature limits
|
|
Remove symmetric fillings/drain
|
Filters out small fuel level changes (e.g., from slope or errors)
|
|
Active
|
Enables monitoring of refueling and draining events
|
PILOT supports two types of calibration tables:
1. Graph calibration table — converts raw values to real ones using a graph. Commonly used for fuel level, weight, temperature, humidity sensors.
2. Text states calibration table — converts raw values into predefined statuses (e.g., “No Signal,” “Weak,” “Good”).
Example: Fuel tank calibration
Suppose the tank has an irregular shape, so volume is not directly proportional to fuel level. The sensor measures resistance (Ohm) instead of liters.
You must perform calibration by emptying and filling the tank step by step, recording resistance at each fuel level.
Example calibration table for a 100-liter tank:
|
Fuel level (L)
|
Resistance (Ohm)
|
|
0
|
180
|
|
10
|
160
|
|
20
|
140
|
|
30
|
120
|
|
40
|
100
|
|
50
|
80
|
|
60
|
60
|
|
70
|
50
|
|
80
|
40
|
|
90
|
20
|
|
100
|
10
|
When the sensor sends 100 Ohm, the system knows there are ~40 liters in the tank.
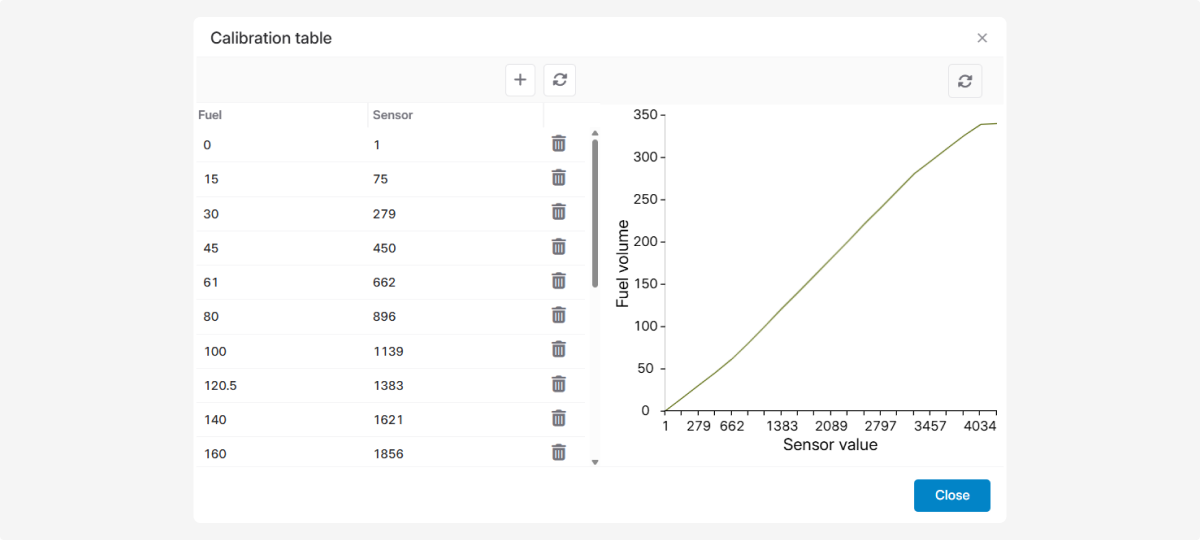
Graph calibration table
This type of calibration table converts sensor readings into real values using a dependency graph. On the X-axis, you see the sensor readings, and on the Y-axis, the actual measured values. A graph is built between the recorded points, which determines the real value for each sensor reading.
This type of calibration table is often used for fuel level sensors, weight, temperature, and humidity sensors.
How to create a table
You can configure the table in the sensor parameters window or upload a ready-made table from a file.
The configured table can be saved to a file and reused for other similar sensors.
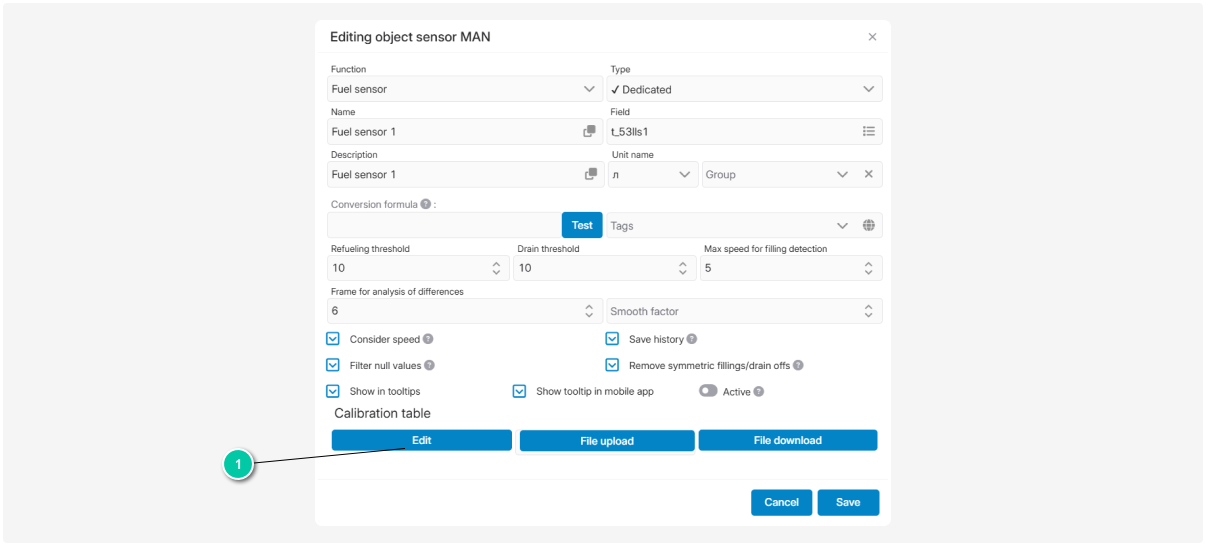
To open the calibration table, click Edit.
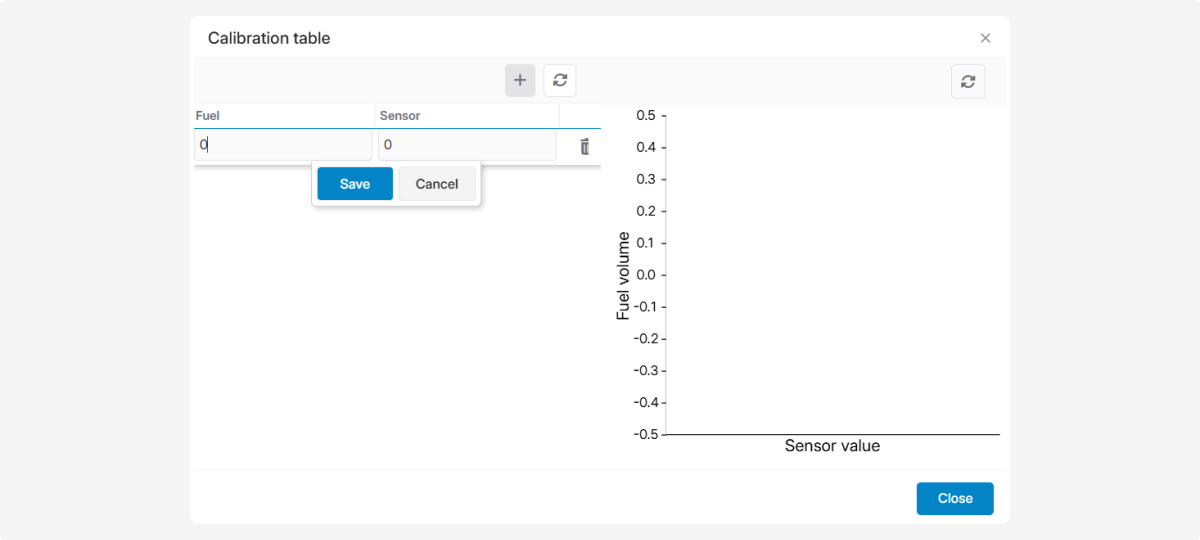
How to add values to the table:
-
Click Add

2. Enter the actual amount of fuel and the value displayed by the sensor
3. Click Save
4. Repeat these steps for all required reading
Text states calibration table
This type of calibration table is used for multi-position sensors and converts sensor readings into predefined statuses.
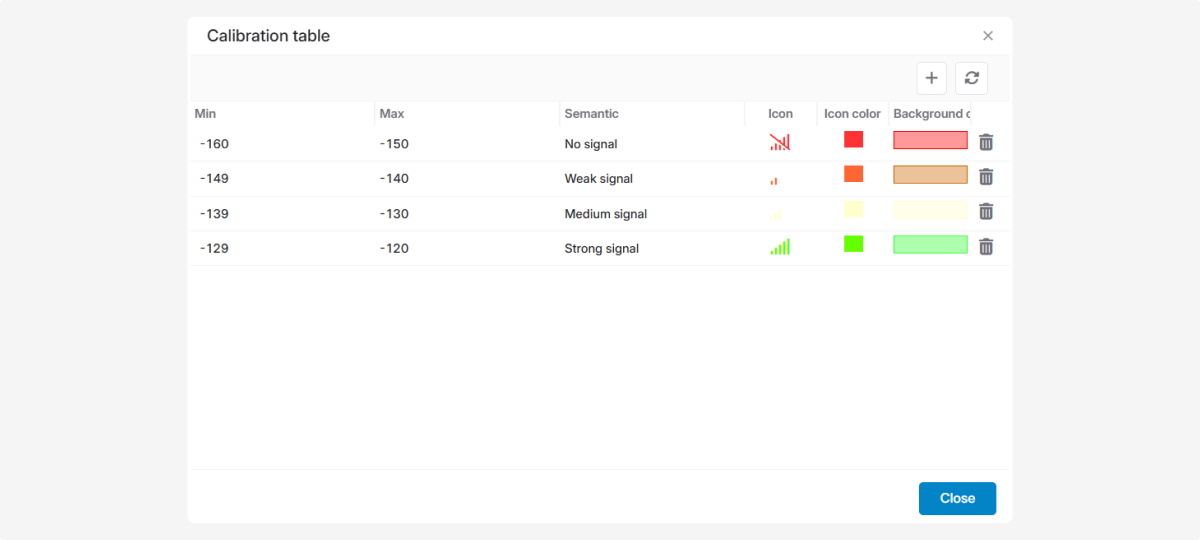
Example of using this type of table
Suppose you have a multi-position GPS antenna sensor that shows signal strength. The GPS receiver measures signal power in dBm, usually ranging from -160 dBm to -120 dBm.
In the table, you translate the technical values from the sensor into understandable statuses:
-
No signal
-
Weak signal
-
Medium signal
-
Strong signalFor example, when the sensor sends a value of -135 dBm, the system finds the corresponding value in the table and translates it into a text status — Weak signal.The text status will appear in the object tooltip and in reports.This type of calibration table can be used for various parameters.For example:Set value ranges for temperature: Cold — 0–10°C, Warm — 10–25°C, Hot — 25°C and aboveShow battery charge not in percentages but in statuses like Low, Medium, Full.How to add a calibration table for multi-position sensors:
-
Open the sensor parameters window2. In the Calibration table section, click Edit3. In the calibration table window, click Add4. Fill in the columns with the sensor’s minimum and maximum values5. Set text statuses in the Semantics column6. Select an icon and a background color for the status. The status color is used in charts and in the track history when displaying routes7. Click Save
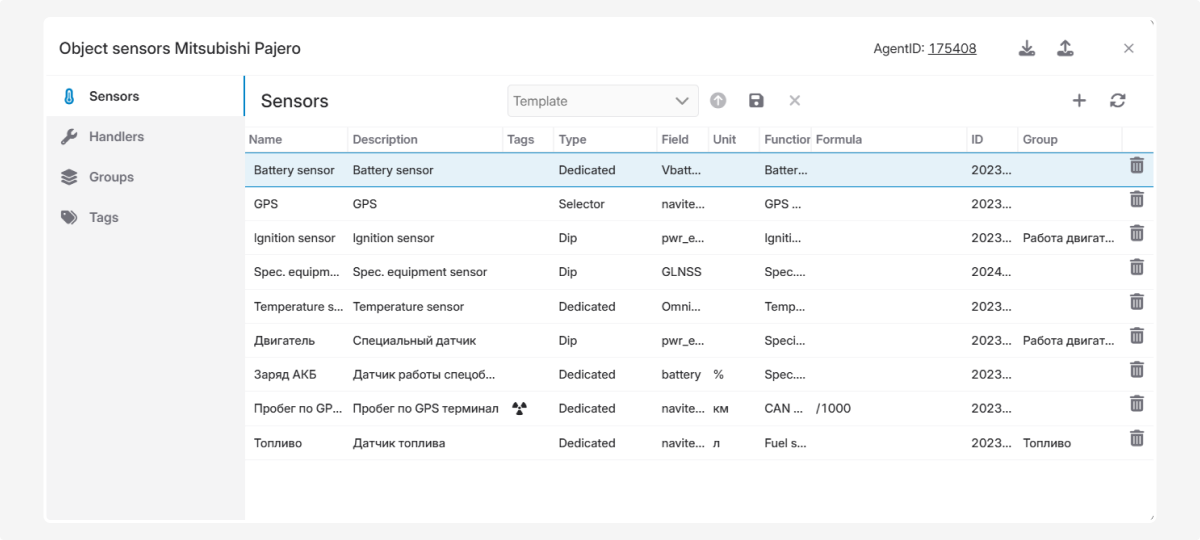
Sensor list
Added sensors appear in the Sensors tab.
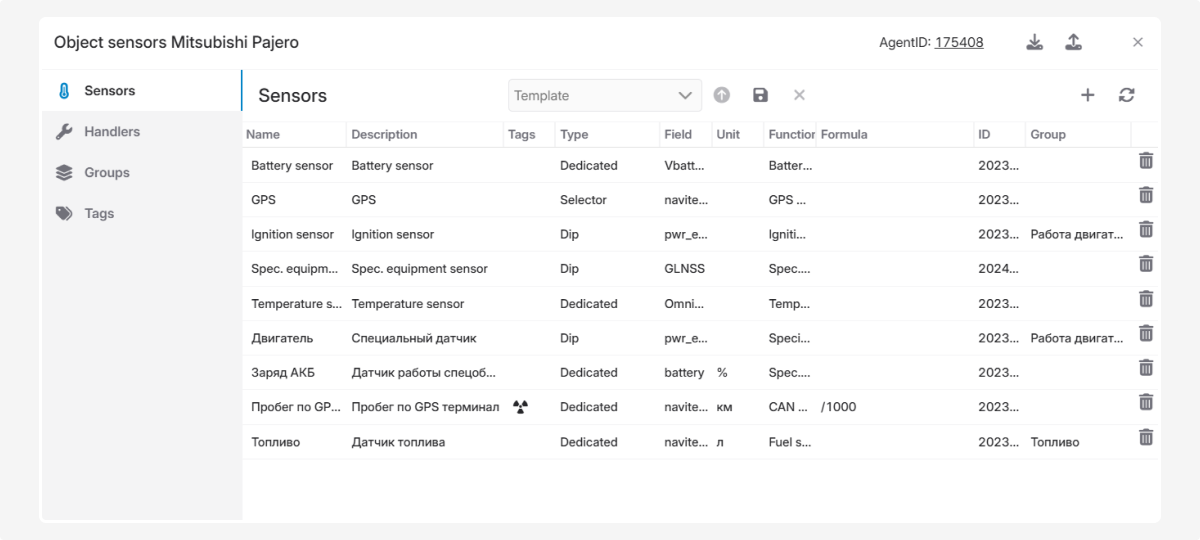
The list contains columns with the same names as the sensor parameters.
You can customize the sensor list table to suit your needs: choose which parameter columns to display and adjust their sorting.
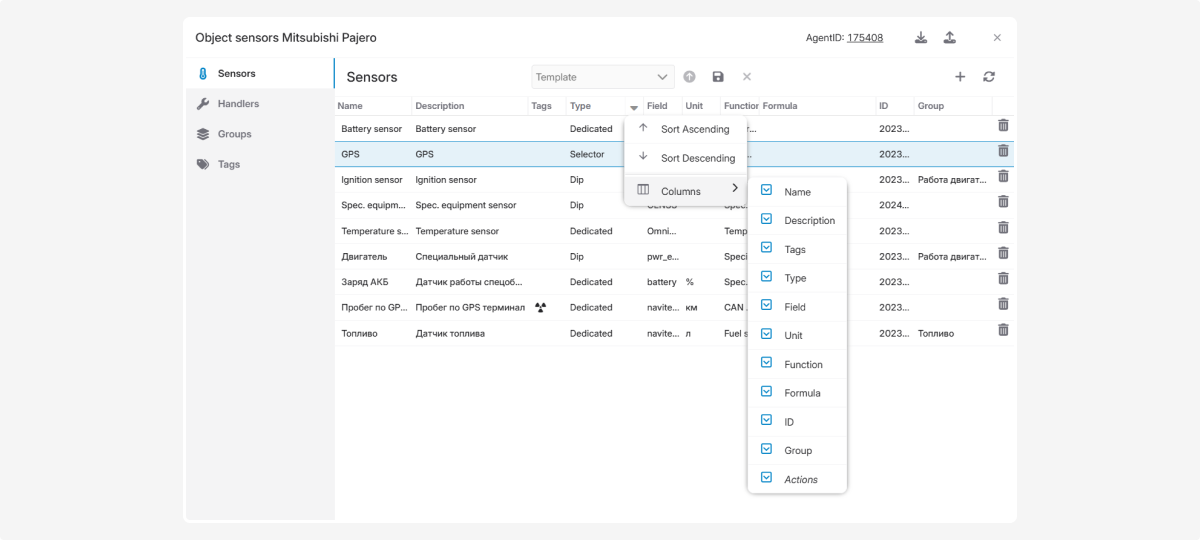
How to customize the sensor list table:
-
In the header of any column, click the small arrow
 . A menu with column settings will appear:
 -
Sort data in ascending or descending order
-
Select which columns to display
2. To adjust which columns are shown:
-
Click Columns — a list of available parameters for display will open
-
Check the boxes next to the parameters you want to see
How to delete a sensor
To delete a sensor, click  in the sensor list.