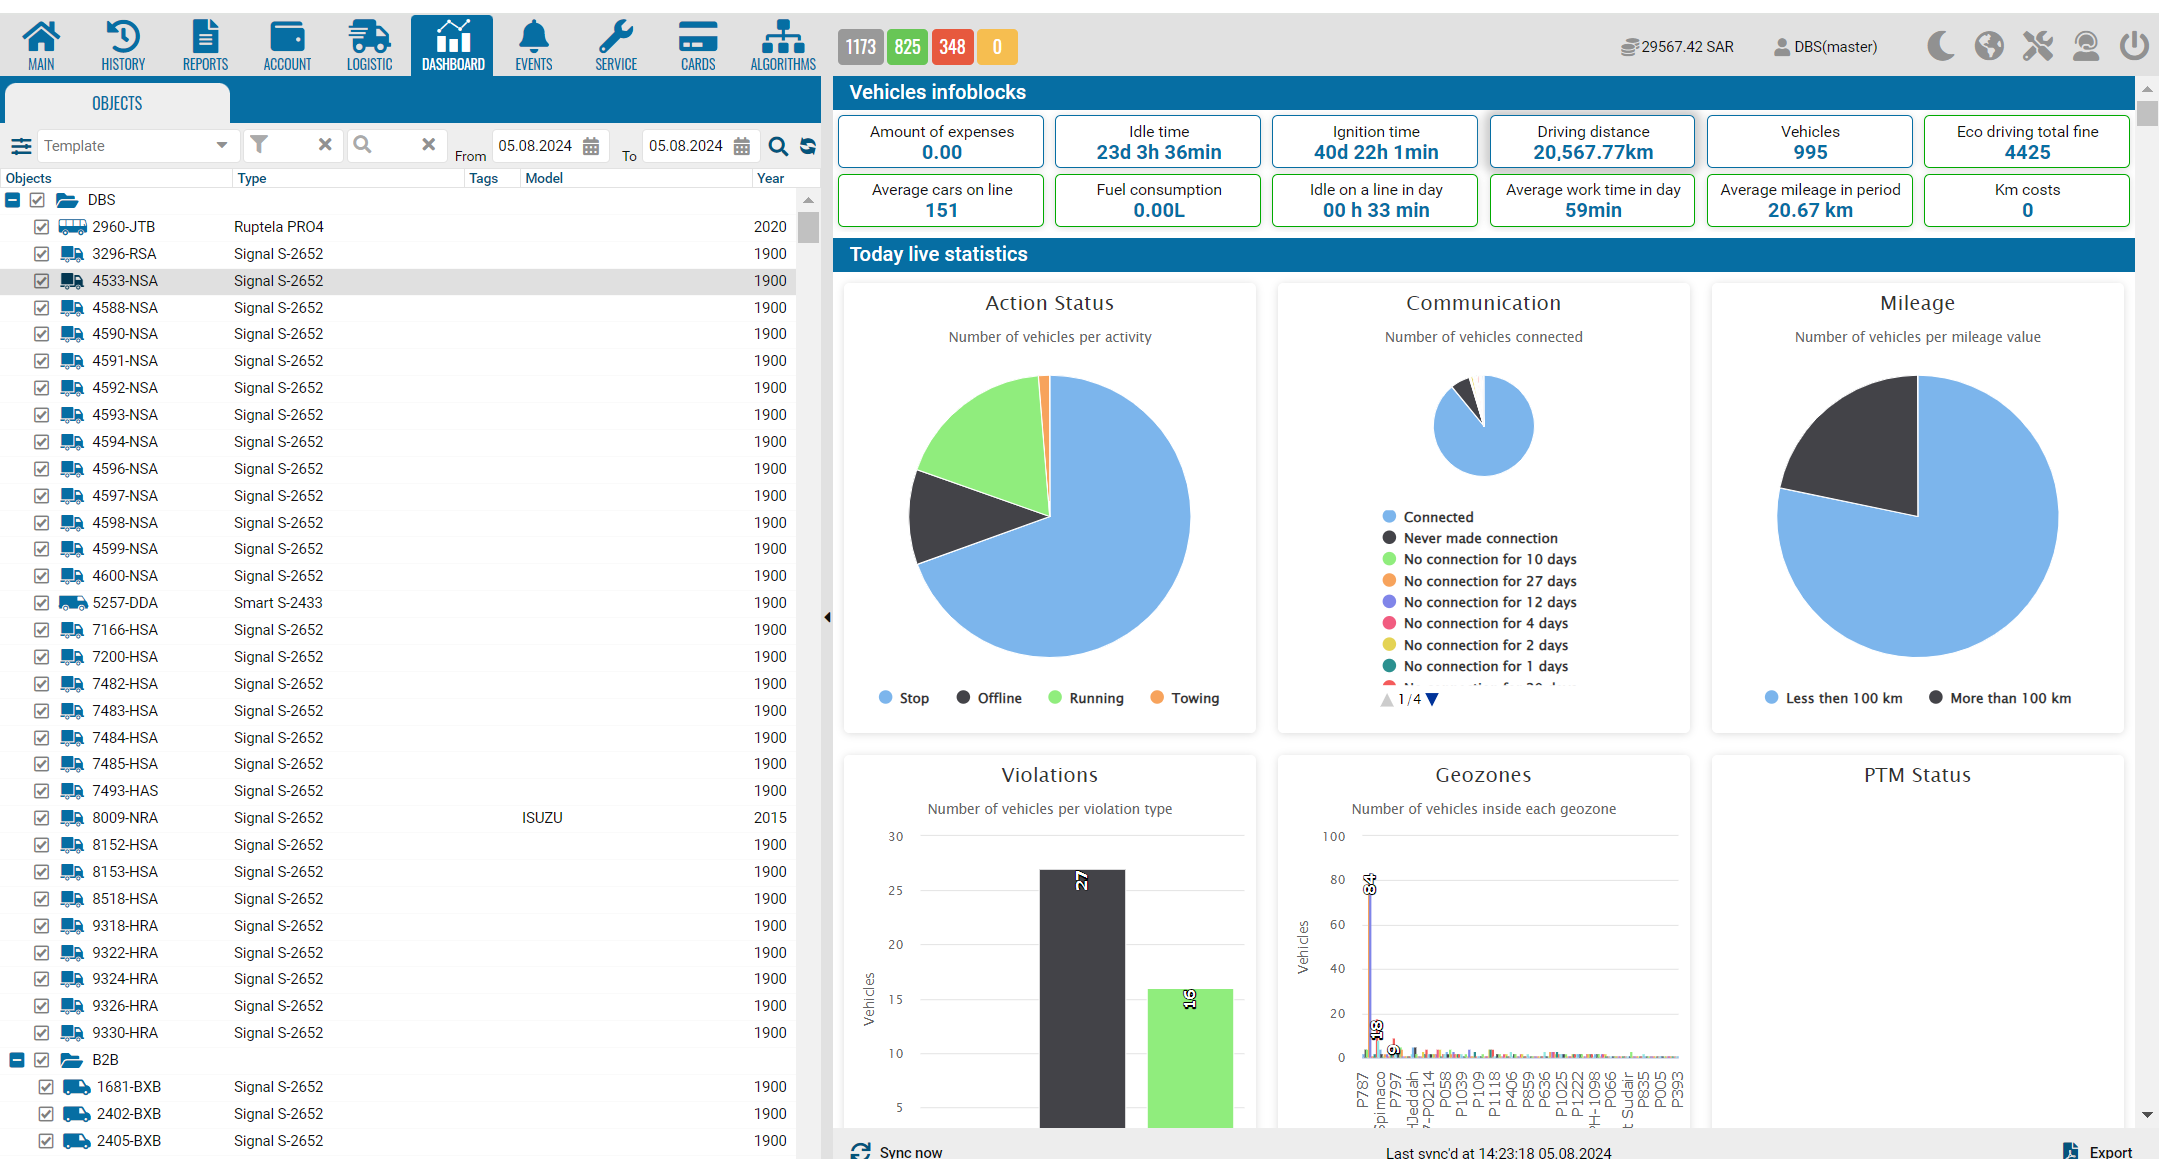
Analytics module (Panel)
Statistics are displayed for the last 24 hours.
This may take a while to load the first time.
But this page will load quickly in the future.
• Open the Panel tab.
• Select an object from the list.
• Select a date.
• View the vehicle info block.
Module operation reports or data from the Analytics module are not provided.
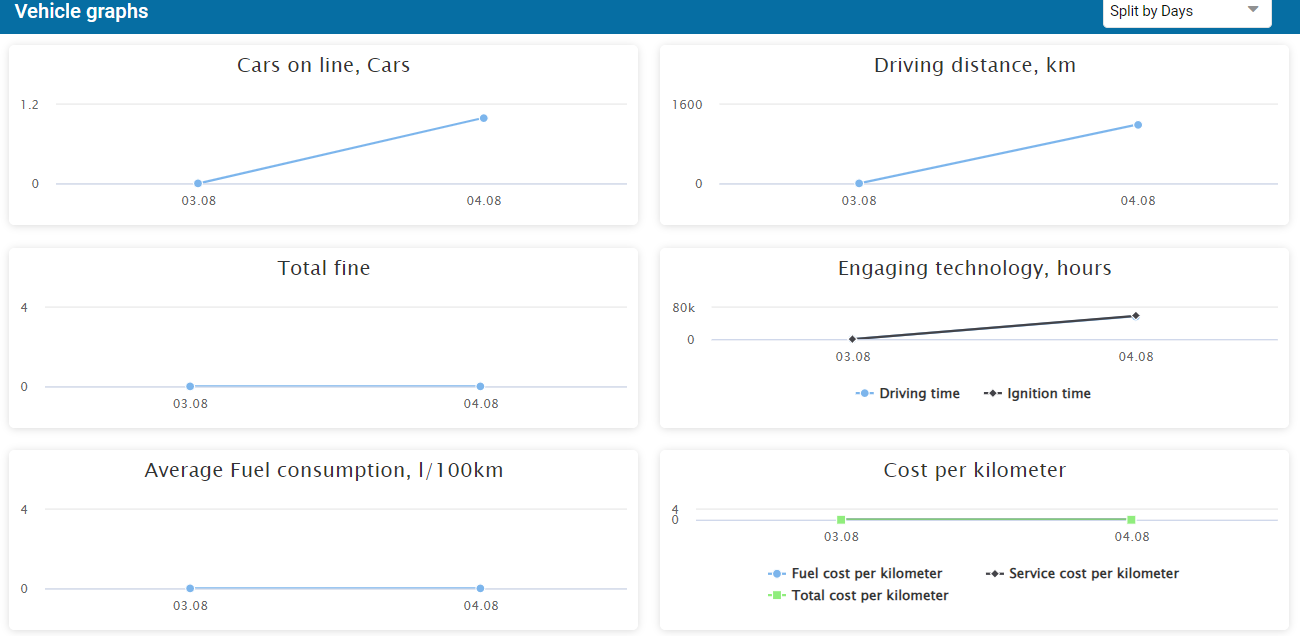
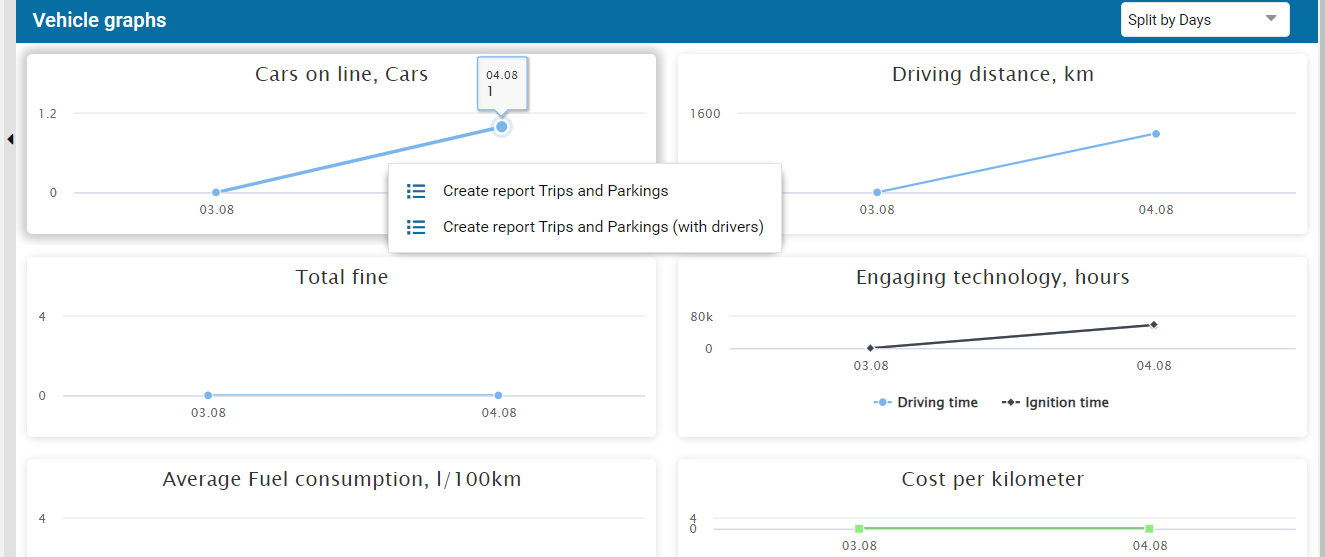
You can work with reports by highlighting them on the chart, as shown below.
Important! Depending on the modules connected, for example Eco Driving, the PTM module or violations in Geofences, these values will also be displayed in graphs on the corresponding topics.
If these modules are not enabled, there will be no graph.
|
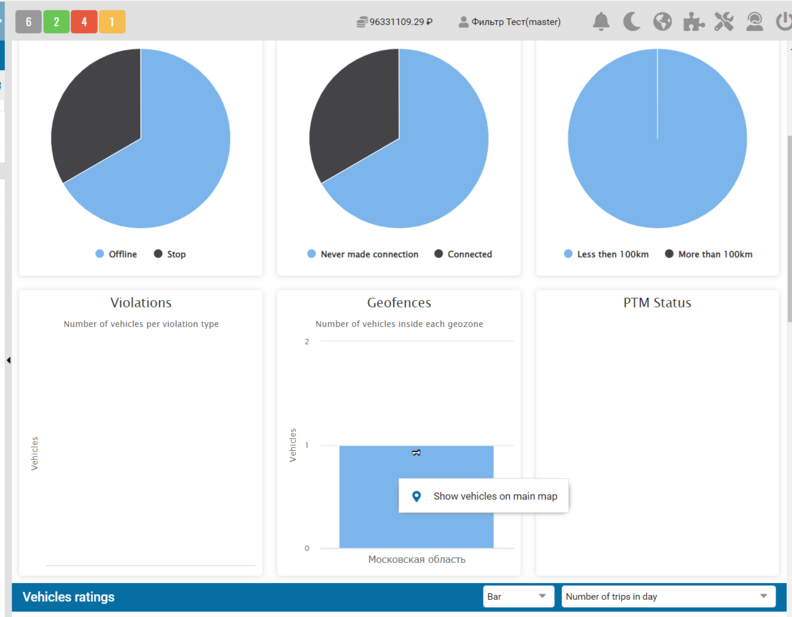
From the geozones block, a transition to the "Online" tab has been implemented with the selection of these vehicles in the tree of objects located in the specified geozones.
How should the objects be displayed?
• Click on the column indicating the geozone.
• Right-click on the menu. "Show vehicles on the main map".
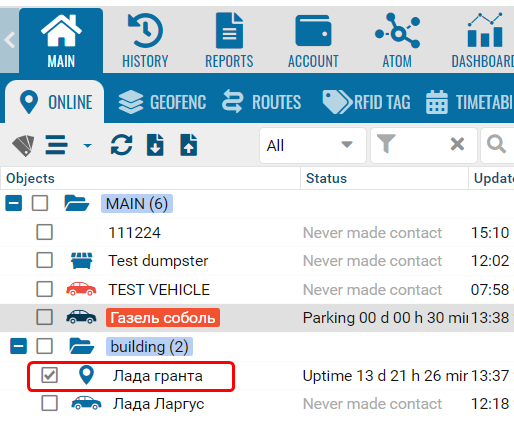
• Only those objects that are in this zone will be selected in the object tree.
Return to the module in the usual way.
This example shows an object that the system has allocated for this geozone.
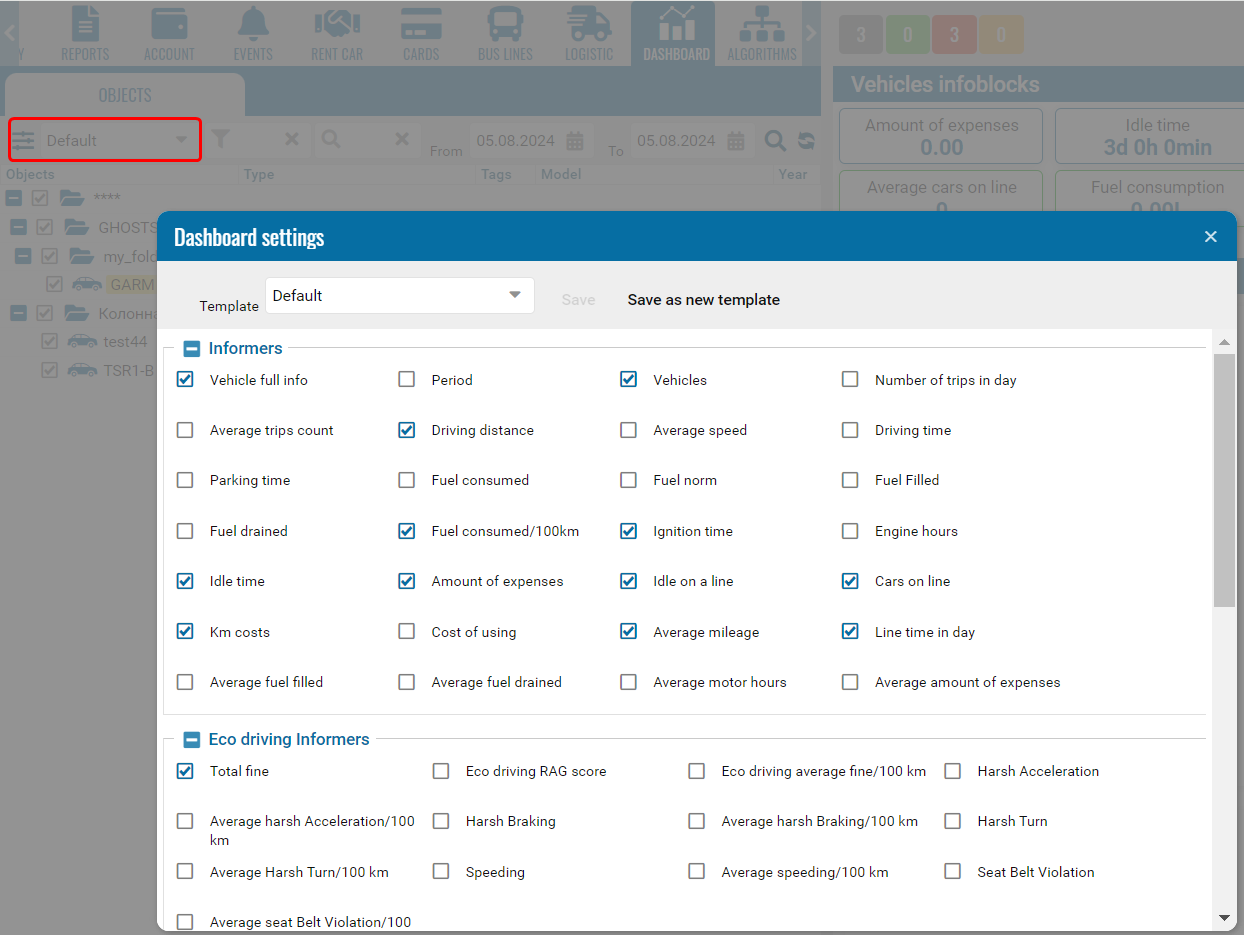
Data refresh button.
Select Template
A user can create their own profile and set it as default.
A system administrator can create a profile and set it as default for a partner account. In this case, all users will see this profile as the default profile.
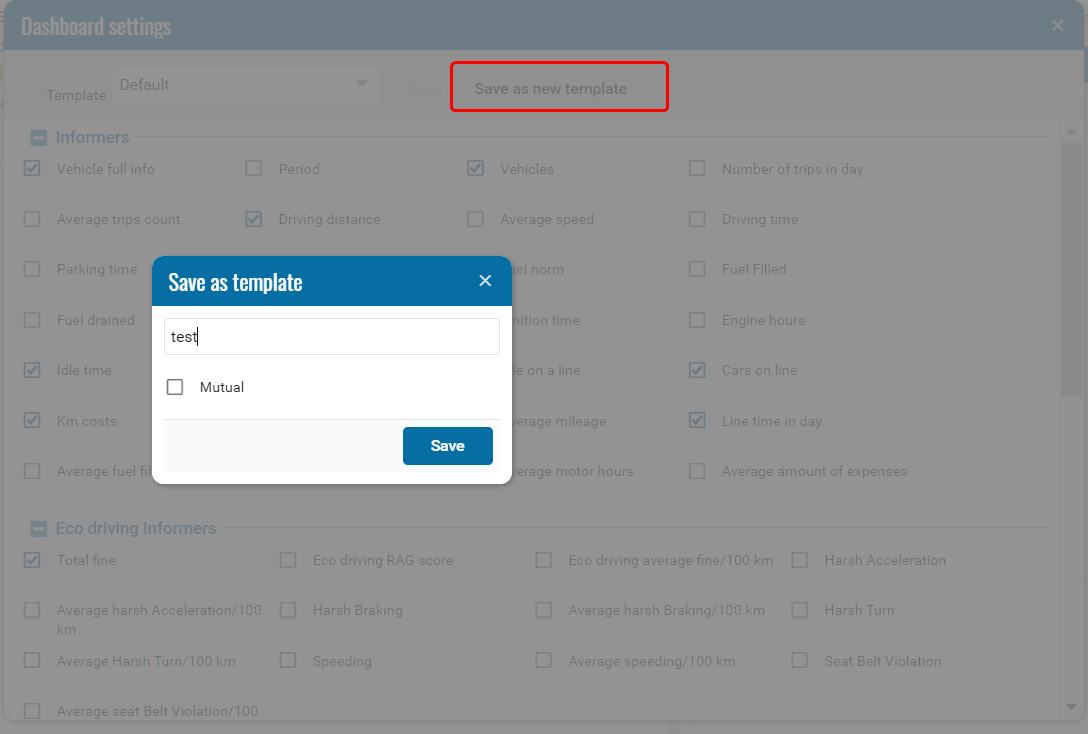
Create template
Once you have selected additional options, click "Save as new".
Right click on the chart and the system will offer several reports to build.
To return to Analytics, click "Back".
Generate reports on relevant topics, for example, reports related to mileage from the mileage chart, fuel consumption from the fuel chart, equipment operation, and others.
|
For example, on the Mileage chart you can build a report:
• Trip and Parkings
• Trip and Parkings (with driver)
The reports will be generated in the regular "Reports" tab with all the details about duration, distance, address and other fields.
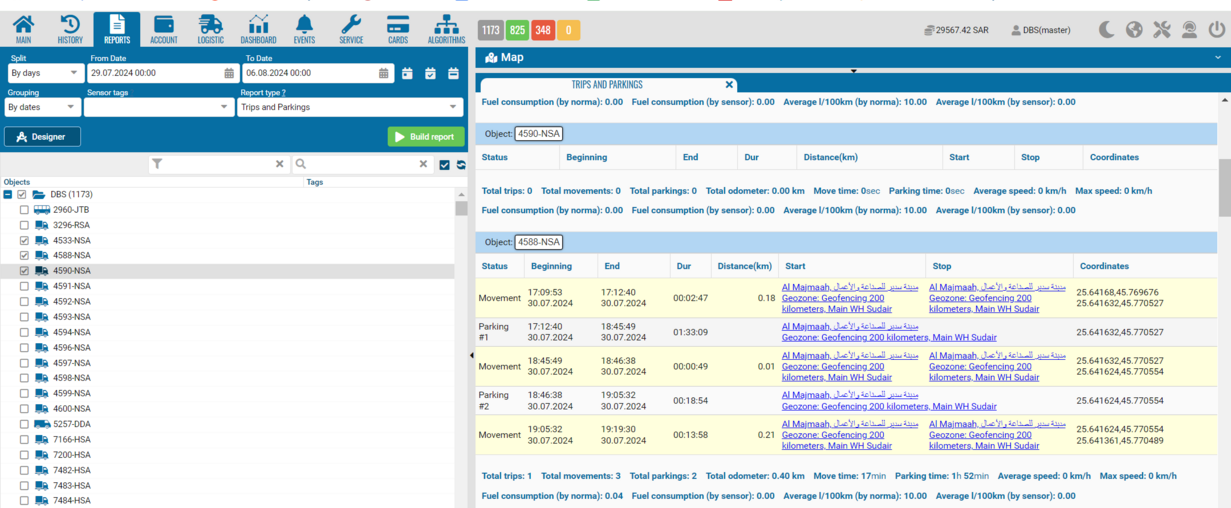
To return to analytics from the Reports section, go to the Dashboard tab in the usual way.
|