Connecting BI Analytics to Power BI
With BI Analytics API, you can connect system data to Power BI and build your own reports, charts, and dashboards.
In this article, we will cover:
To view the BI Analytics API method structure, you can use the API documentation in Swagger format: BI API v1 — Swagger
In the Swagger documentation, you can:
-
view all available API methods
-
check the request and response structure
-
download the API specification in JSON format
Access to the BI Analytics API is configured at two levels:
1. Partner account level
2. User account level
To enable access, you need to:
-
Enable the Analytics Module for the partner
-
Enable the Analytics Module for the user's account
-
Add the bi_analytics = 1 configuration to the partner card
If you don't have access to the module settings or configuration on the partner account, please contact our support team.
|
1. Enable the Analytics module on the partner account
1. In the admin panel, go to the Partners section

2. Double-click on the selected partner — the partner card will open
3. Go to the Modules tab and enable the Analytics module

4. Next, go to the Configuration tab
5. Click the Add button

6. In the list, select the bi_analytics configuration and set its value to 1
7. Save your changes
2. Enable the Analytics module on the user's account
After enabling the module on the partner account, you also need to enable it for the specific user's account.
1. In the admin panel, find the required account
2. Right-click on it and select Edit

3. In the account card, go to the Modules tab
4. Enable the Analytics module

5. Save your changes
Once the Analytics module is enabled on both the partner account and the user's account, and the bi_analytics configuration is set — access to the BI Analytics API will be enabled.
The system will start collecting analytics data, and you will be able to connect to the API through Power BI.
To connect to the BI Analytics API, you need the partner account login and password.
Use the same credentials that were provided when the partner account was registered. These are the same login details used to sign in to the admin panel.
If you have main administrator access, you can find these credentials in the partner account card under the Main settings tab:
-
Login — use as username
-
Password — use as password

To connect to BI Analytics API, you need to specify the server address in the BaseUrl parameter in the query. Use the server where your account is hosted.
|
Server
|
Address
|
Purpose
|
|
Production
|
https://pilot-gps.com
|
Main server
|
|
Saudi Arabia
|
https://ksa.pilot-gps.com
|
Regional server for Saudi Arabia
|
|
Africa
|
https://pilot-gps.africa
|
Regional server for Africa
|
|
Blade
|
https://blade.pilot-gps.com
|
Blade server
|
|
Iglit
|
https://gps.iglit.tech
|
Iglit server
|
In the query, specify the required URL, for example:
BaseUrl = "https://ksa.pilot-gps.com",
|
To keep the system stable, BI Analytics API has request limits.
Default limits
These limits apply by default if the bi_analytics_limit parameter is not set:
-
100 requests per hour
-
2000 requests per day
-
50000 requests per month (30 days)
-
metrics_max: 20 — maximum 20 metrics per request
If needed, you can set custom limits for the account.
To do this, add the bi_analytics_limit parameter in the account configuration and set its value to a JSON object with limits.
Example JSON
{
"rate_limits": [
{ "window": 3600, "limit": 20 },
{ "window": 86400, "limit": 20 },
{ "window": 2592000, "limit": 20 }
],
"metrics_max": 4
}
|
-
window — time period in seconds
-
3600 = 1 hour
-
86400 = 1 day
-
2592000 = 30 days
-
limit — maximum number of requests for the specified period
-
metrics_max — maximum number of metrics in one request
This guide will help you connect BI Analytics data to Microsoft Power BI and create your own charts and reports.
How to add a query in Power BI
1. Open Power BI Desktop
Launch Power BI Desktop on your computer. If it is not installed, download it for free from the official Microsoft website.

2. On the main toolbar at the top, click the Get Data button. A list of available data sources will appear

3. From the list of data sources, select Blank query

4. The Power query editor will open. This is the window where queries are created and configured.
In this window, find the Advanced editor button on the top toolbar and click it.

5. The Advanced editor window will open with an empty query template.
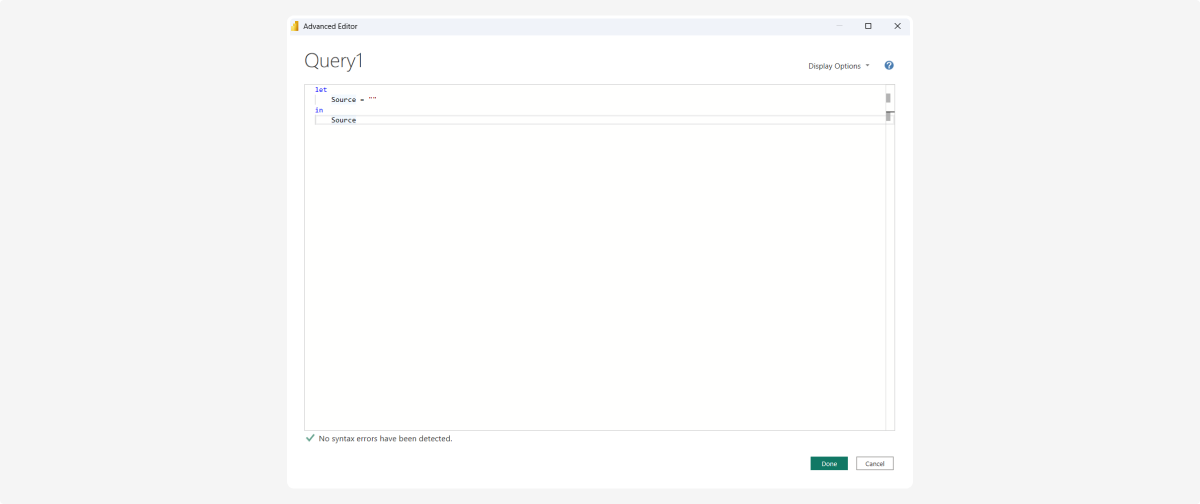
6. Paste the query code into the editor. See the example query below

In the query, you need to specify:
-
Server address — the URL of your server
-
Login — your login from the partner account
-
Password — your password from the partner account
-
Dates — the start and end dates of the period
-
List of metrics — which data you want to retrieve (see the full list of metrics below)7. After pasting the code, click DonePower BI will start connecting to the server and loading data.8. After that, Power BI may display the warning “Information is required about data privacy”. Click Continue.

9. The Privacy levels window will open.
In this window, Power BI checks whether it can safely combine and process data from the sources used in the query. In our case, the query uses one trusted data source, and authorization is already handled inside the query itself. To prevent Power BI from blocking the load or interfering with query execution, check: Ignore privacy levels checks for this file.
Then click Save.

10. After saving, Power BI will execute the query and open a data preview in Power query editor.
You will see a table with rows and columns — this is the data returned by your query.

11. Click Close & Apply. After that, the data will be loaded into Power BI, and you can start working with it.

Now you can use the loaded data to create charts, tables, and other visual elements.
In the main Power BI Desktop window, the following panels are usually displayed on the right:
-
Visualizations — contains chart types, diagrams, cards, tables, and other visual elements. Choose the type you need, then fill it with your fields
-
Data — shows the list of tables and fields loaded from your query, such as date, object ID, mileage, fuel consumption, and average speed. You can use these fields in visualizations by selecting them with checkboxes, dragging them with the mouse, or rearranging them
-
Filters — lets you limit data using the conditions you need

How to build a chart
1. In the Visualizations panel, click the chart type you need. A blank chart template will appear on the report canvas
2. In the Data panel, select the fields you want to display

3. Power BI will automatically place the selected fields into the chart.
In Power BI, you can combine data in different ways:
-
add the same field to multiple charts
-
compare several indicators
-
build multiple visualizations on one page
-
replace fields without recreating the report from scratch

let
BaseUrl = "https://<server_address>,
LoginJson =
Json.Document(
Web.Contents(
BaseUrl,
[
RelativePath = "api/bi/login.php",
Headers = [#"Content-Type" = "application/json"],
Content = Json.FromValue([
username = "YOUR_LOGIN",
password = "YOUR_PASSWORD"
]),
ManualStatusHandling = {400, 401, 403, 404, 500}
]
)
),
Token = LoginJson[access_token],
NodeId = LoginJson[user][node_id],
AnalyticsJson =
Json.Document(
Web.Contents(
BaseUrl,
[
RelativePath = "api/bi/analytics.php",
Query = [node = Text.From(NodeId)],
Headers = [
#"Authorization" = "Bearer " & Token,
#"Content-Type" = "application/json"
],
Content = Json.FromValue([
date_from = "2026-01-01",
date_to = "2026-12-31",
metrics = {
"veh_driving_dist",
"veh_fuel_cons",
"average_speed",
"veh_cars_counter"
},
source = "vehicle",
group_by = "source_day",
format = "flat"
]),
ManualStatusHandling = {400, 401, 403, 404, 500},
ExcludedFromCacheKey = {"Authorization"}
]
)
),
DataList = AnalyticsJson[data],
Tbl = Table.FromList(DataList, Splitter.SplitByNothing(), {"Column1"}),
Expanded = Table.ExpandRecordColumn(
Tbl,
"Column1",
{"source_id", "date", "veh_driving_dist", "veh_fuel_cons", "average_speed", "veh_cars_counter"}
)
in
Expanded
|
If the query doesn't update or you get login errors
Sometimes Power BI saves the previous connection settings for a data source. Even if you change the login, password, or server address, the query may keep returning an authorization error because Power BI is still using the old credentials. In this case, you need to clear the saved permissions so that Power BI asks for the credentials again.
How to clear permissions
1. In the Power Query Editor, click Data source settings on the toolbar
2. In the window that opens, select the data source you need — for example, your server address

1 — Button Data source settings
2 — Select your data source
3 — Button Clear Permissions
3. Click Clear Permissions
4. In the confirmation window, click Delete

5. Run the query again. Power BI will reapply the connection settings with the new credentials.
source
The source field defines which data the query should use.
Available values:
-
vehicle — vehicle data
-
driver — driver data
group_by
The group_by field defines how the result is grouped.
|
Value
|
What it shows
|
Example response structure
|
|
total
|
Total for all vehicles or drivers for the selected period
|
{ "metric": 123 }
|
|
day
|
Total for all vehicles or drivers for each day
|
{ "20260301": { "metric": 123 } }
|
|
rating
|
Each source, total for the selected period
|
{ source_id: { "metric": 123 } }
|
|
source_day
|
Each source, each day
|
{ source_id: { "20260301": { "metric": 123 } } }
|
ACCOUNT_ID
The ACCOUNT_ID parameter allows you to limit the data export to a single account.
If the query uses the partner account login and password without ACCOUNT_ID, the system will export all vehicles across all accounts available to that partner.
If you specify ACCOUNT_ID in the query, only the objects from the selected account will be loaded.
Below is the list of parameters you can use in the metrics field.
Vehicle — general
|
Parameter
|
Description
|
|
veh_trips_cnt
|
Number of trips
|
|
veh_driving_dist
|
Mileage (km)
|
|
veh_driving_time
|
Driving time
|
|
veh_parking_time
|
Parking time
|
|
veh_ignition_time
|
Ignition on time
|
|
veh_idle_time
|
Idle time
|
|
veh_motor_hours
|
Engine hours
|
Vehicle — fuel
|
Parameter
|
Description
|
|
veh_fuel_cons
|
Fuel consumption
|
|
veh_fuel_filled
|
Fuel filled
|
|
veh_fuel_drained
|
Fuel drained
|
Vehicle — violations
|
Parameter
|
Description
|
|
veh_eco_fine
|
Eco-driving fine
|
|
veh_eco_cnt
|
Number of eco-driving violations
|
|
veh_acc_fine
|
Harsh acceleration fine
|
|
veh_acc_cnt
|
Number of harsh accelerations
|
|
veh_braking_fine
|
Harsh braking fine
|
|
veh_braking_cnt
|
Number of harsh braking events
|
|
veh_turn_fine
|
Harsh turn fine
|
|
veh_turn_cnt
|
Number of harsh turns
|
|
veh_speed_fine
|
Speeding fine
|
|
veh_speed_cnt
|
Number of speeding events
|
|
veh_belt_fine
|
Seat belt violation fine
|
|
veh_belt_cnt
|
Number of seat belt violations
|
|
veh_idle_fine
|
Idle fine
|
|
veh_idle_cnt
|
Number of idle violations
|
Vehicle — costs
|
Parameter
|
Description
|
|
veh_fuel_cost_per_kilometer
|
Fuel cost per km
|
|
veh_service_cost_per_kilometer
|
Service cost per km
|
|
veh_amount_exp
|
Total expenses
|
|
cost_of_using
|
Cost of use
|
|
average_speed
|
Average speed
|
|
veh_cars_counter
|
Number of vehicles
|
Drivers
|
Parameter
|
Description
|
|
drv_trips_cnt
|
Number of trips
|
|
drv_driving_dist
|
Mileage (km)
|
|
drv_driving_time
|
Driving time
|
|
drv_parking_time
|
Parking time
|
|
drv_fuel_cons
|
Fuel consumption
|
|
drv_fuel_filled
|
Fuel filled
|
|
drv_fuel_drained
|
Fuel drained
|
|
drv_eco_fine
|
Eco-driving fine
|
|
drv_eco_cnt
|
Number of eco-driving violations
|
|
drv_acc_fine
|
Harsh acceleration fine
|
|
drv_acc_cnt
|
Number of harsh accelerations
|
|
drv_braking_fine
|
Harsh braking fine
|
|
drv_braking_cnt
|
Number of harsh braking events
|
|
drv_turn_fine
|
Harsh turn fine
|
|
drv_turn_cnt
|
Number of harsh turns
|
|
drv_speed_fine
|
Speeding fine
|
|
drv_speed_cnt
|
Number of speeding events
|
|
drv_belt_fine
|
Seat belt violation fine
|
|
drv_belt_cnt
|
Number of seat belt violations
|
Rental
|
Parameter
|
Description
|
|
qlick_rent_time
|
Rental time
|
|
qlick_idle_time
|
Idle time
|
|
qlick_block_time
|
Blocking time
|
|
qlick_block_count
|
Number of blocks
|
|
qlick_charge_time
|
Charging time
|
|
qlick_charge_count
|
Number of charging events
|
|
qlick_booked_time
|
Booking time
|
|
qlick_booked_count
|
Number of bookings
|
|
qlick_rent_count
|
Number of rentals
|
|
qlick_claim_count
|
Number of claims
|
|
qlick_payments_count
|
Number of payments
|
|
qlick_money_amount
|
Amount of money
|
|
qlick_bonus_charge
|
Bonus accrual amount
|
|
qlick_bonus_charge_count
|
Number of bonus accruals
|
|
qlick_bonus_charge_from_pilot
|
Bonus amount accrued by PILOT
|
|
qlick_bonus_charge_from_pilot_count
|
Number of bonus accruals by PILOT
|
|
qlick_success_invoices
|
Successful invoices (by account)
|
|
qlick_failure_invoices_account
|
Failed invoices (by account)
|
|
qlick_payment
|
Payment
|
|
qlick_bonus_pay
|
Bonus payment
|
|
qlick_bonus_charge_pilot
|
Bonus accrual by PILOT
|
|
qlick_bonus_charge_user
|
Bonus accrual by user
|
|
qlick_bonus_discharge_pilot
|
PILOT bonus write-off
|
|
qlick_refund
|
Refund
|
Custom eco metrics
For eco events, you can use the following template:
-
eco_{N}_fine
-
eco_{N}_cnt
where N is the ID of the eco event type in the system.
Examples
|
Parameter
|
Description
|
|
eco_4_fine / eco_4_cnt
|
Eco violations of type 4
|
|
eco_8_fine / eco_8_cnt
|
Eco violations of type 8
|
|
eco_17_fine / eco_17_cnt
|
Eco violations of type 17
|