Crash detection
The Crash detection module tracks and processes crash events sent by a vehicle.
What the module includes
-
Notification settings — enable the Crash detection notification type in the Account settings
-
Event display in history — crash events are saved in history and shown on the map and charts
How to enable crash notifications
1. Go to Account settings
2. Open the Notifications tab

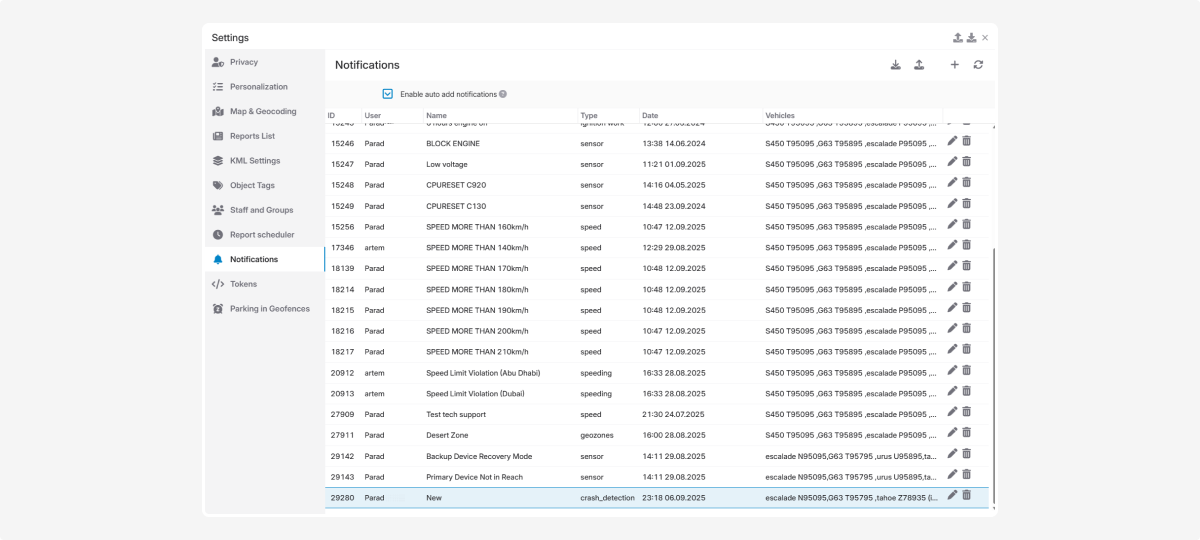
3. Click Add notification 
4. In the list of notification types, enable Crash detection
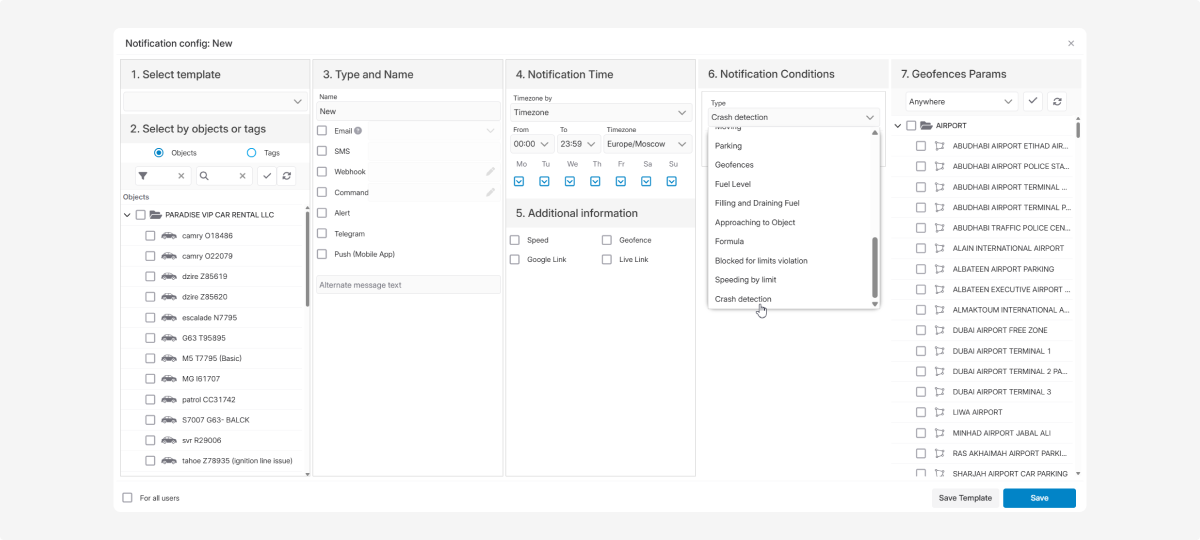
5. Click Save
Once enabled, the system will monitor incoming Crash tags from the vehicle and send you notifications.
How notifications work
When the system receives a crash signal (Crash tag) from a vehicle, it processes it as follows:
-
If the crash data can be decoded (Crash_id), the notification will include detailed crash information.
-
If the data cannot be decoded, you’ll receive a standard message: Crash detected!
To avoid a flood of repeated messages (since a device may send the same crash tag multiple times):
1. The system reacts only to the first crash signal and sends a notification.
2. Any duplicate crash tags are ignored until the system receives a “clean” point (without a crash tag).
3. If another crash tag is received after that clean point, you’ll get a new crash notification.
This way, you receive only one notification per crash, not multiple repeats.
|
Crash history
To find and review a crash event:
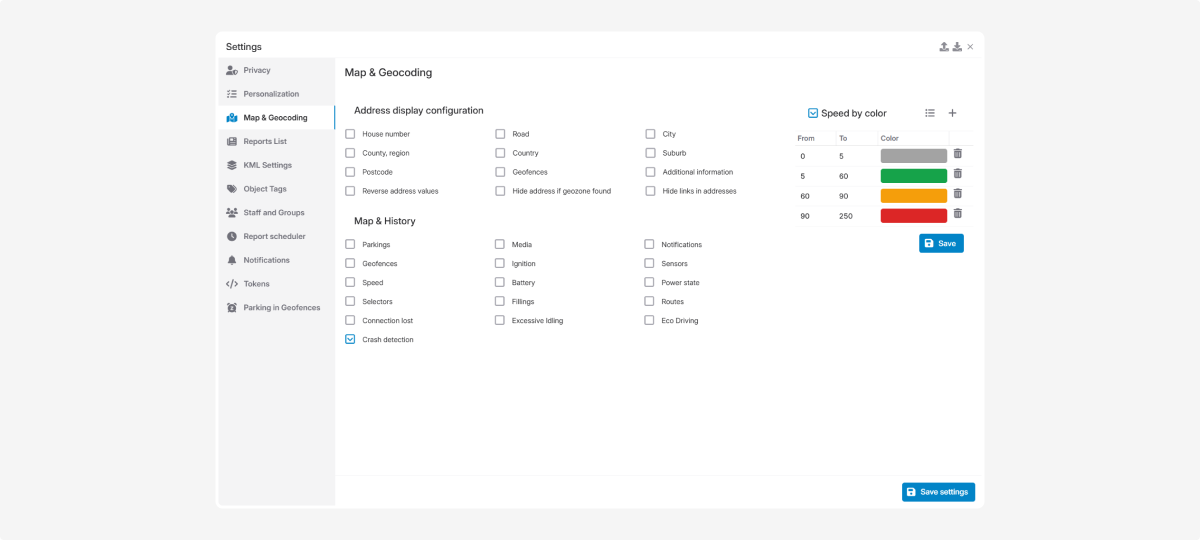
1. Go to the History section
Make sure crash events are enabled in Account settings → Map & geocoding → Map & history → Crash detection.
 |
2. Select the date range when the crash occurred
3. Choose the history tracks
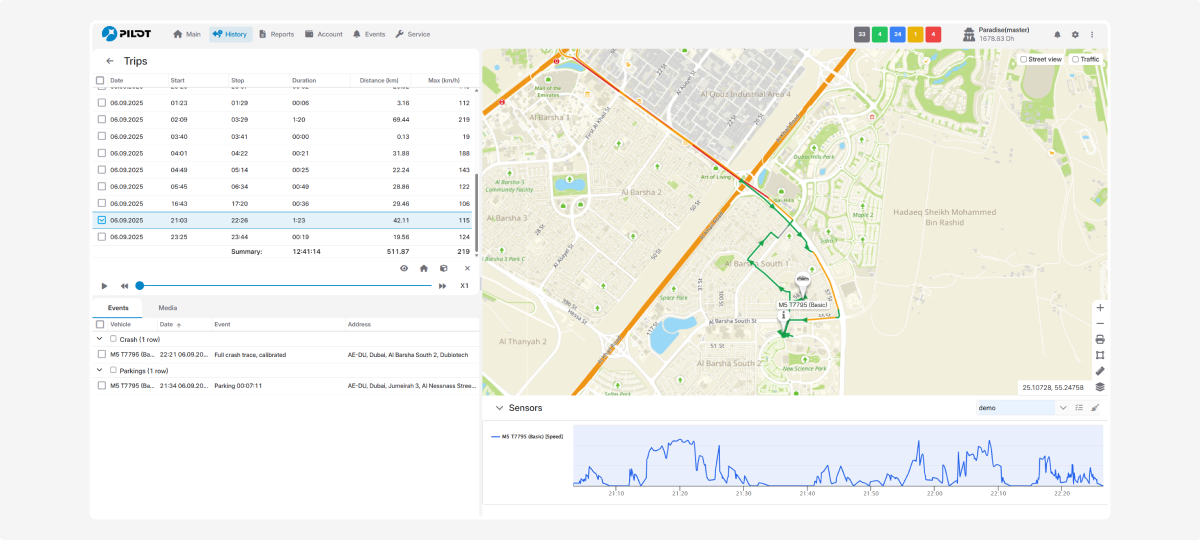
4. Open the Events tab in the history panel
5. Locate the crash event on the map (marked with an icon)
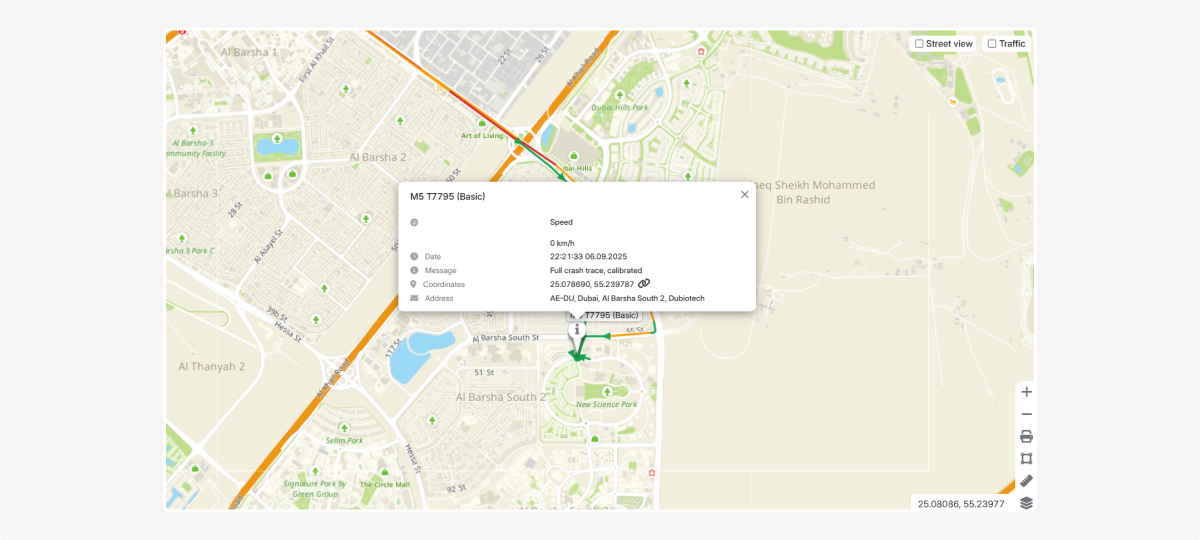
6. Click the marker to view the crash graph
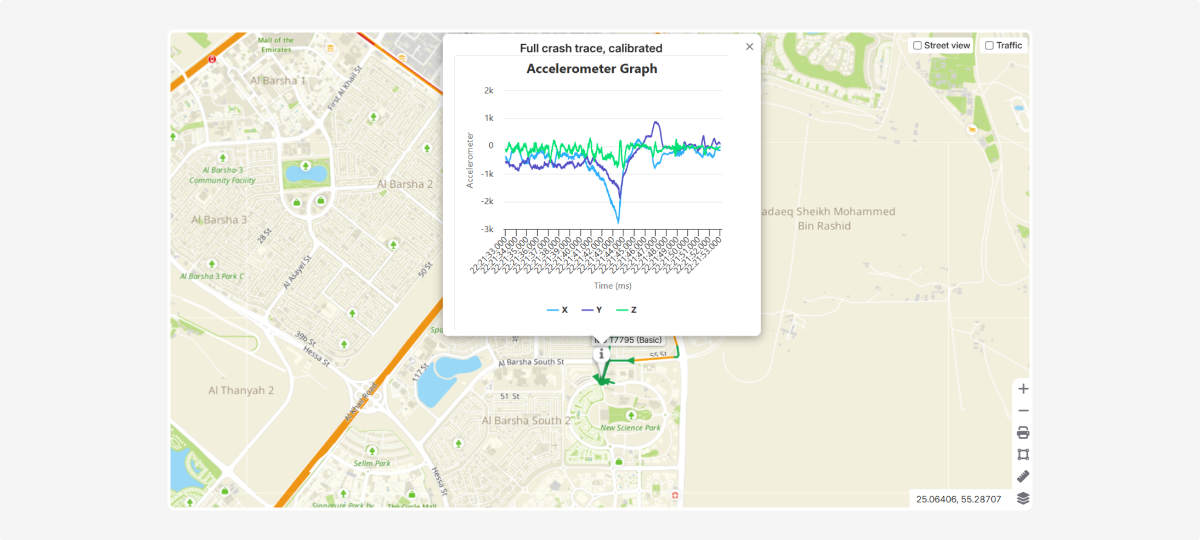
Crash graph
The graph shows how forces affected the vehicle at the time of the crash. Data comes from the accelerometer — a sensor that records acceleration and sudden changes in movement.
The graph includes three main axes:
-
Blue (X) — forward/backward movement (acceleration, hard braking, frontal impact)
-
Purple (Y) — left/right movement (sharp turns, side impacts)
-
Green (Z) — up/down movement (bumps, obstacles, bottom impact)
Sharp spikes or drops indicate the moment of impact.
They help identify the type of crash: frontal, side, or combined.
Graph axes
-
Y-axis (vertical) — acceleration/deceleration force (in accelerometer units)
-
X-axis (horizontal) — time (milliseconds)
Example interpretation
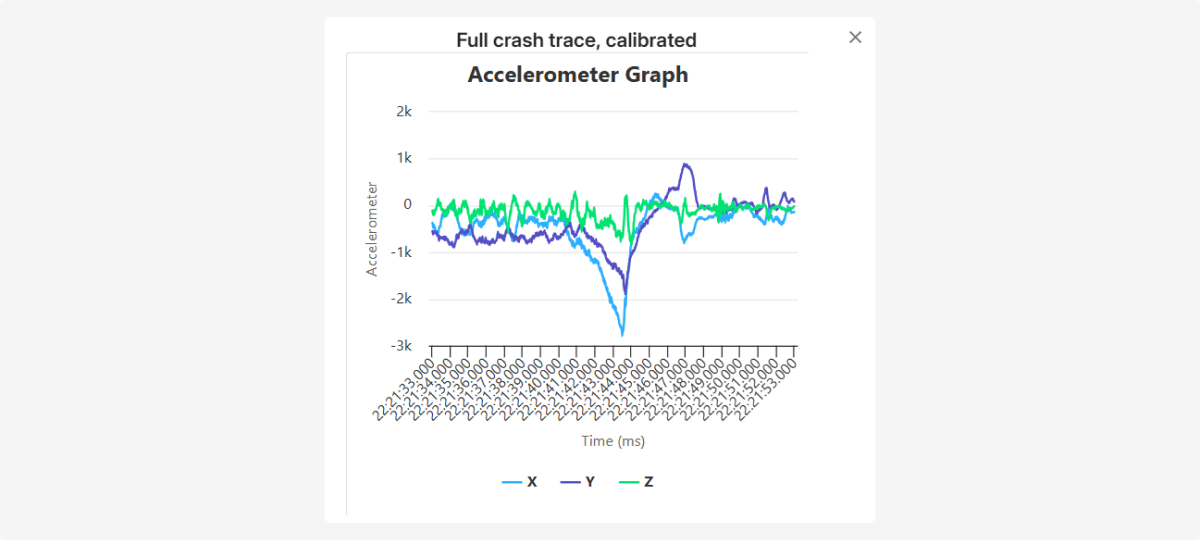
Before the crash, the lines oscillate around 0 — the car was moving steadily.
At the center, there is a sharp drop (blue X and purple Y) — the impact moment, with strong braking and a sideways shift.
After the crash, the lines return closer to zero but show small ripples — vibrations after the collision.