Interface overview
After signing in to PTM, the electronic dispatching console opens. Use the sidebar to switch between sections and the workspace to view and process tasks, bids, resources, acts, and reports.
This article describes the main interface elements:

The sidebar contains the main PILOT Task Manager sections. Click a menu item to open the corresponding workspace.

-
Dashboard — tasks, resources, bids, and tenders
-
Acts — documents related to tasks
-
Reports and Reports v2 — reporting data available in the respective versions
-
Users — user accounts and access permissions
-
Queue — tasks waiting to be processed
-
Dictionary — data used to create and process tasks
-
Settings — PTM configuration
-
Calendar and Calendar v2 — view tasks by date
-
Private office — information and settings for the current user
-
Sandbox — a test workspace
Click the arrow 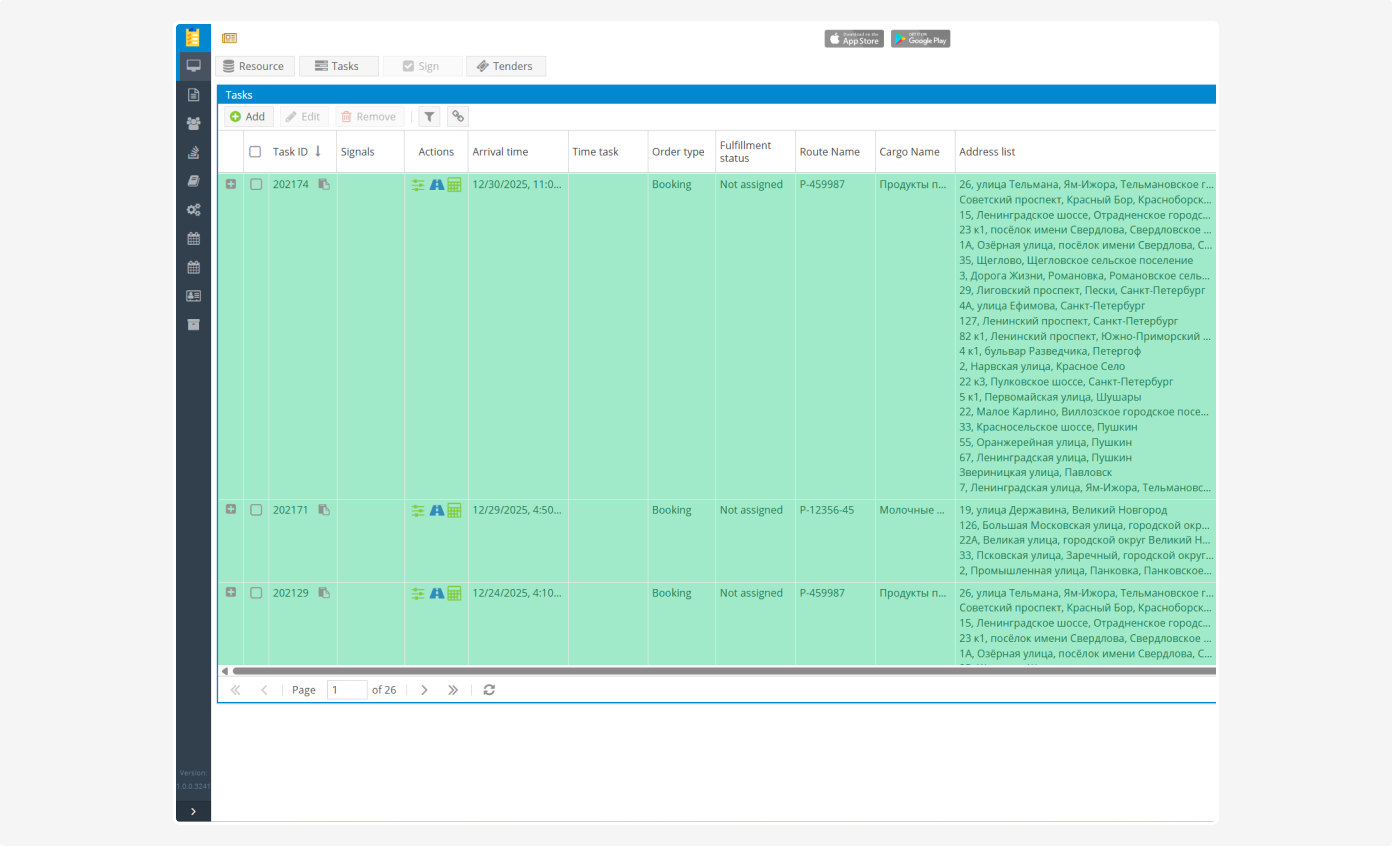 at the bottom of the sidebar to collapse the menu.
In the collapsed view, only section icons remain. Click the arrow again to display the section names.

On the left side of the top bar, you can find the news button  and links to the PILOT Driver mobile applications in the App Store and Google Play.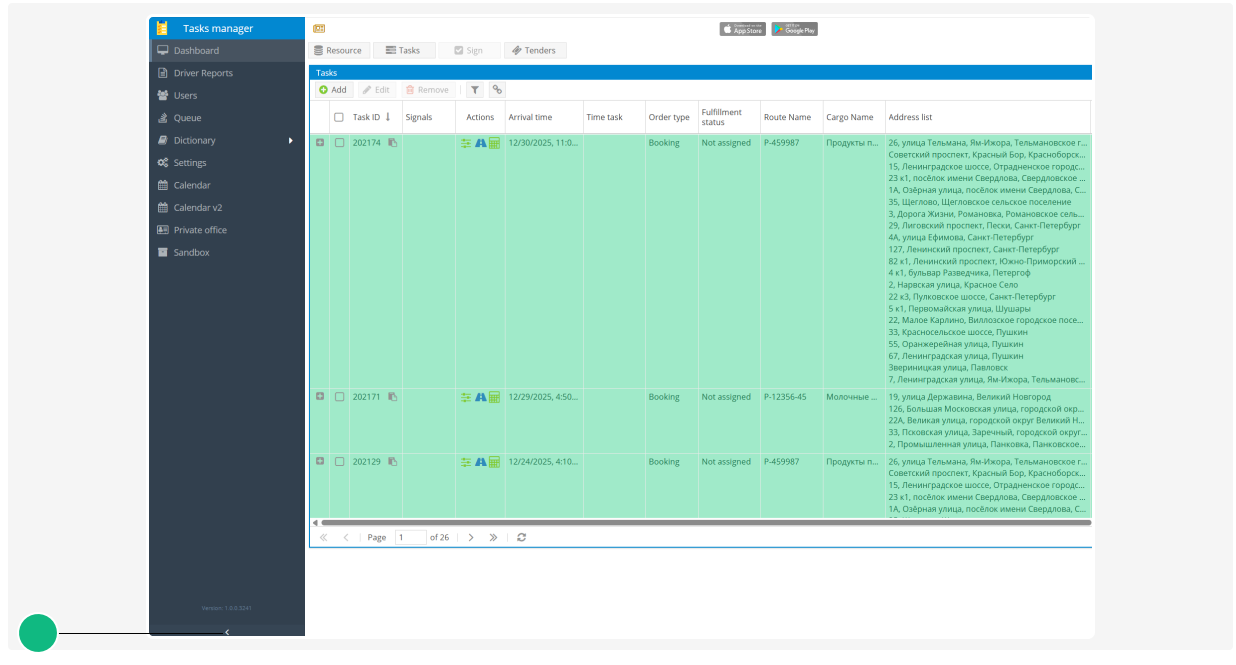
The news button opens messages about system updates and changes.

The following controls are available on the right:

 Switch to the updated interface — opens the new interface for testing
 Clear table settings — removes the saved column order and applied filters from the browser’s local storage
 Sound — turns sound notifications on or off
 Bell — opens system notifications, such as notifications about new tasks

 Envelope — opens important messages, including reminders about the remaining SMS balance
 Language — changes the interface language
 Log out — ends your PTM session
The numbers displayed on the notification and message icons depend on the current account and change as new events arrive.
The workspace content changes depending on the selected section.
For example, the Dashboard contains task and resource areas.
The Acts section displays a table of acts with search, date range, and filter options.

The bottom of the sidebar displays:
-
the PTM version
-
the profile icon
-
the name of the current account
-
the account email address
