Truck load report
The Truck load report provides information about the utilization of the selected monitored objects during the specified period. It allows you to compare equipment idling time and work under load, as well as determine the total engine hours and distance traveled.
The report helps evaluate equipment operating efficiency, identify prolonged operation without a productive load, reduce downtime, and allocate resources more effectively.
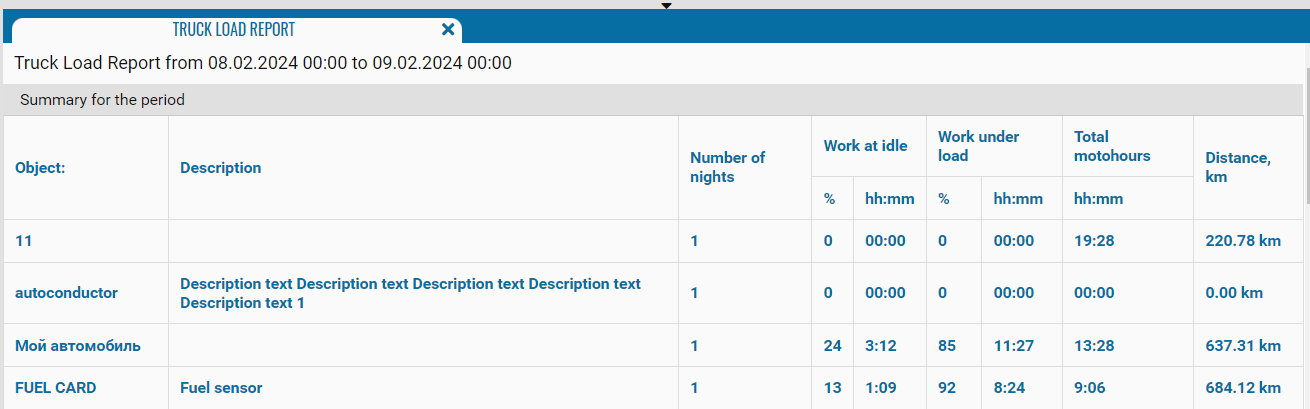
Report structure
The report contains several sections:
-
Summary for the period — summary values for all selected objects
-
Use of equipment for the period — a pie chart showing the proportion of parking, idling, and work under load
-
Object details — daily values for each selected object
What the summary table shows
-
Object — the name, registration number, or fleet number of the monitored object
-
Description — additional information about the object. If no description is specified, the field remains blank
-
Number of nights — the number of calendar days included in the analyzed period
-
Work at idle — the time during which the engine operated without a registered productive load. The value is shown in two columns:
-
% — the proportion of idling calculated by the system
-
hh:mm — the idling duration in hours and minutes
-
Work under load — the time during which the equipment performed productive work. The value is shown in two columns:
-
% — the proportion of work under load calculated by the system
-
hh:mm — the duration of work under load in hours and minutes
-
Total motohours — the total engine operating time for the corresponding period, shown in hh:mm format
-
Distance, km — the distance traveled by the object during the specified period

Equipment utilization chart
Below the summary table, the Use of equipment for the period section contains a pie chart showing the proportion of the equipment’s main states:
-
Parking — the time during which the equipment was not operating or moving
-
Idling — the time during which the engine was running without a productive load
-
Work under load — the time during which the equipment performed productive work
The chart provides a visual comparison of these states and shows how much of the selected period was spent performing productive work, idling, or parked.

Object details
Below the chart, separate daily sections are displayed for each object. Each daily section shows:
-
Description — additional information about the object
-
Work at idle — the percentage and duration of idling
-
Work under load — the percentage and duration of work under load
-
Total motohours — the total engine operating time for the corresponding day
-
Distance, km — the distance traveled by the object on the corresponding date
This breakdown helps compare an object’s performance across different days and identify periods of high workload, prolonged idling, or inactivity.
