Working with reports
-
In the main menu, go to the Reports section
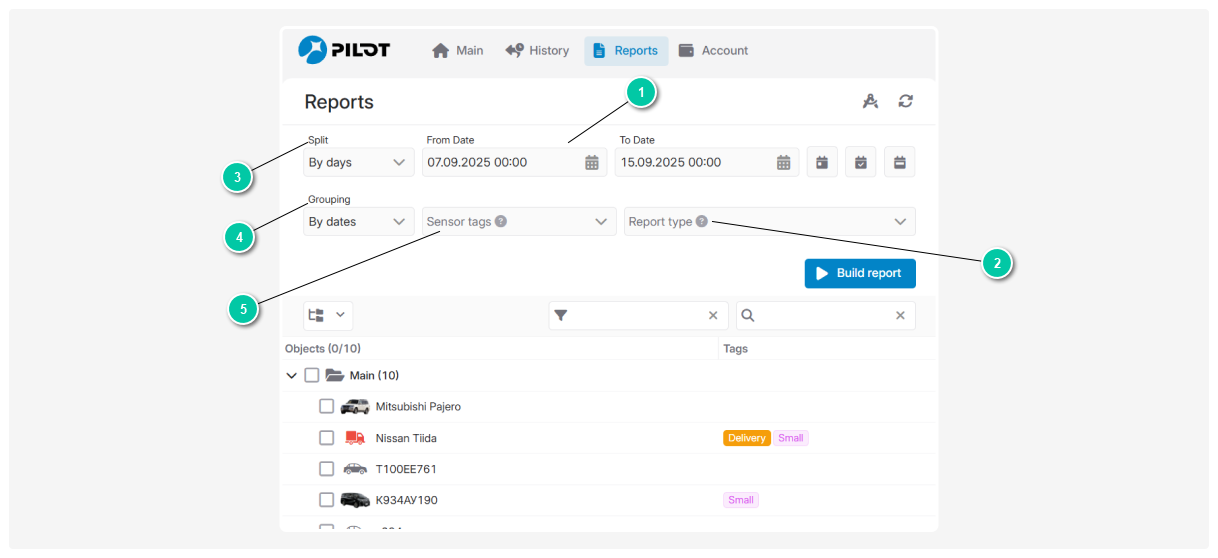
2. Select an object by checking the box next to it in the object list
3. Set the time range for the report
-
Choose the time interval for the report by clicking the calendar icon
-
Or use quick buttons — report for Yesterday, Today, or Last week.
4. Select the report type from the dropdown list
5. Specify parameters for the report
6. Click Build report, and you will see the finished report with the chosen parameters
How to work with a report
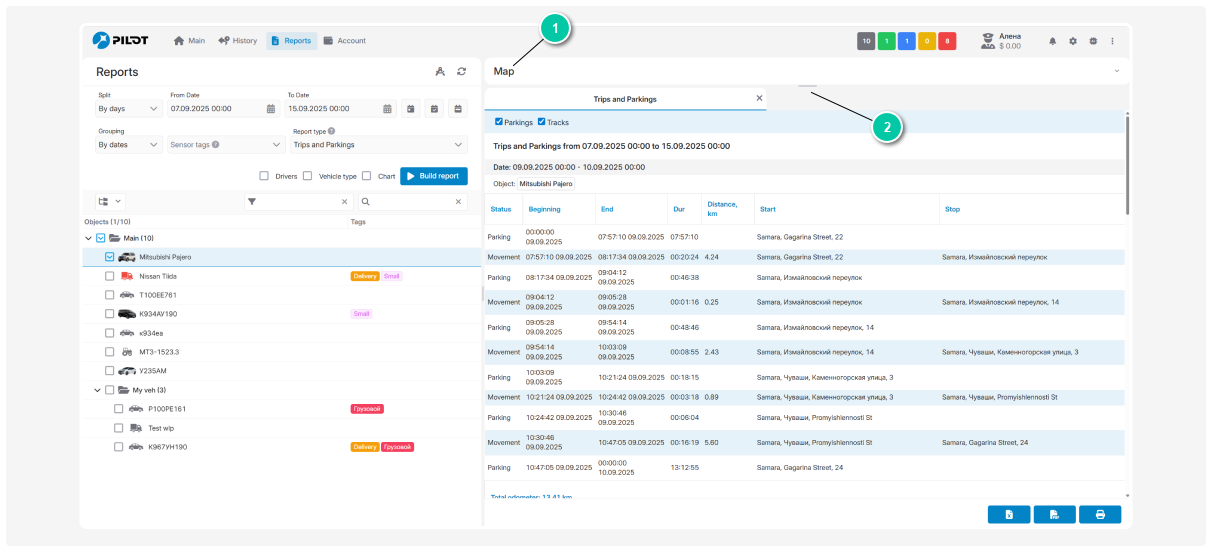
Once the report is created, you will immediately see the results online.
Interactive map
Some reports include an interactive map to help you visualize report data.
To expand the map area, simply drag the screen divider.
For example:
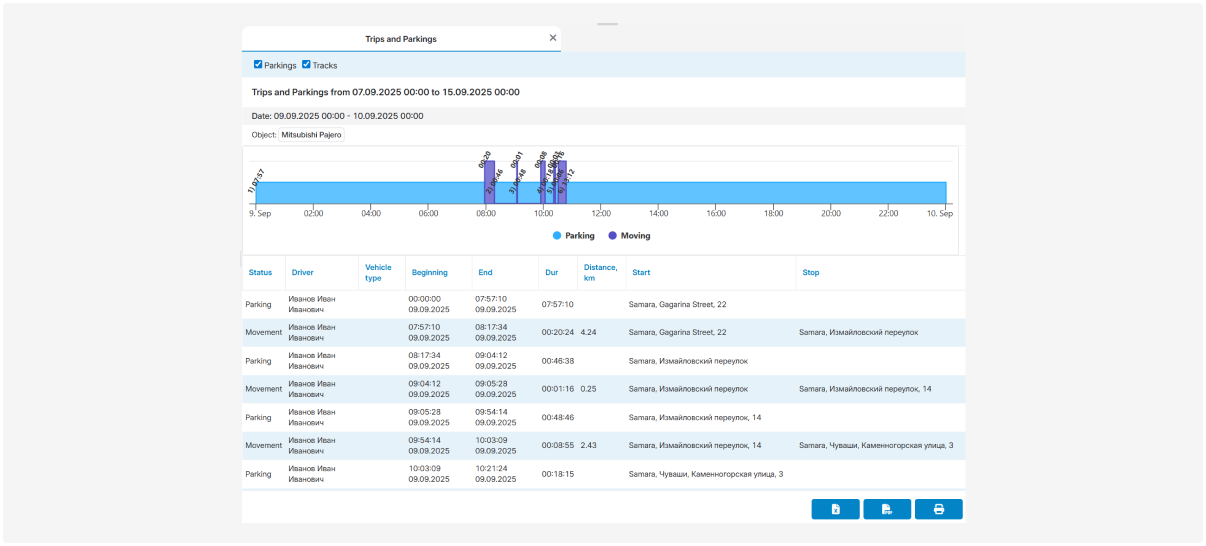
In trip reports, you can select a specific record, and the map will display the corresponding route with start and end markers.
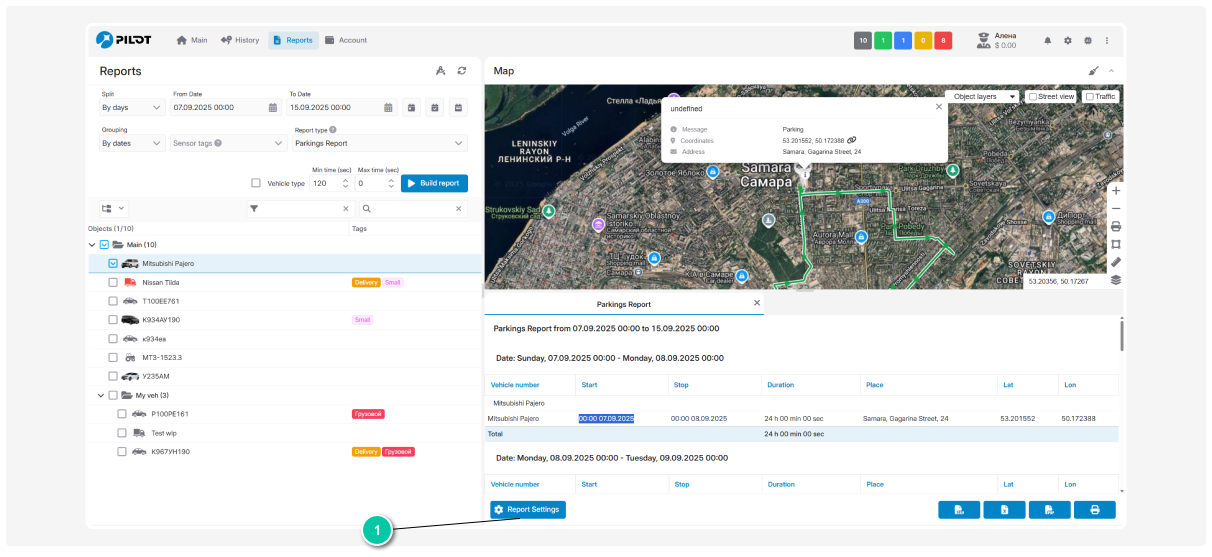
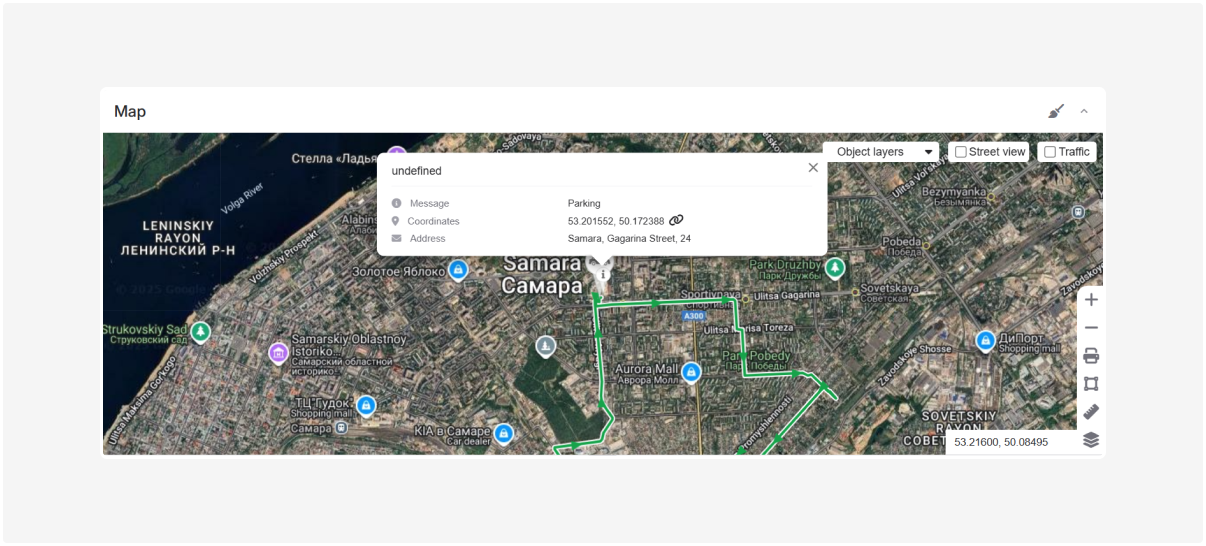
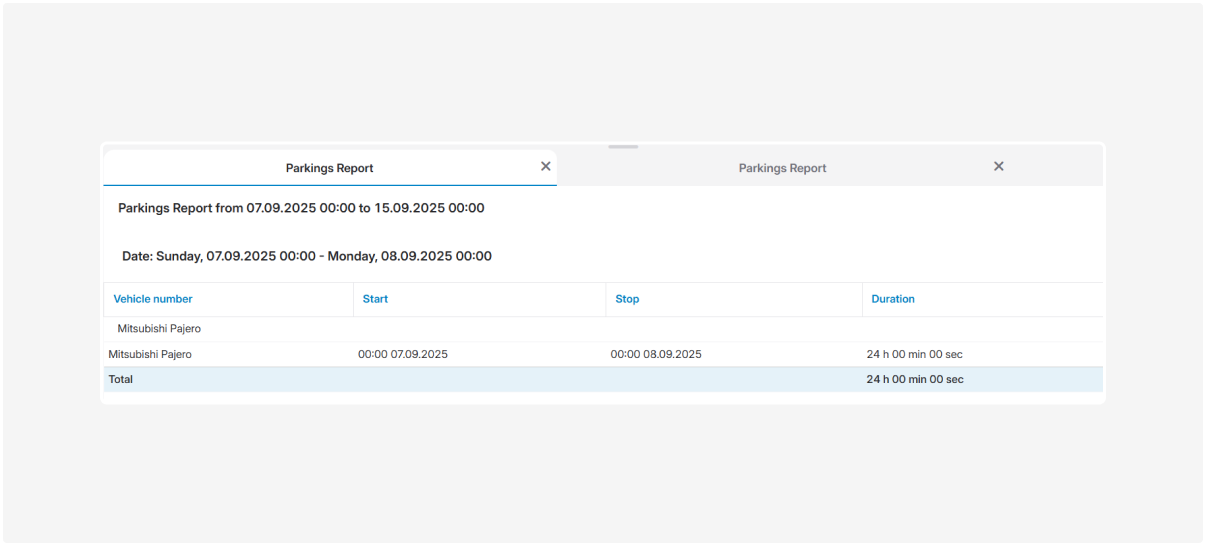
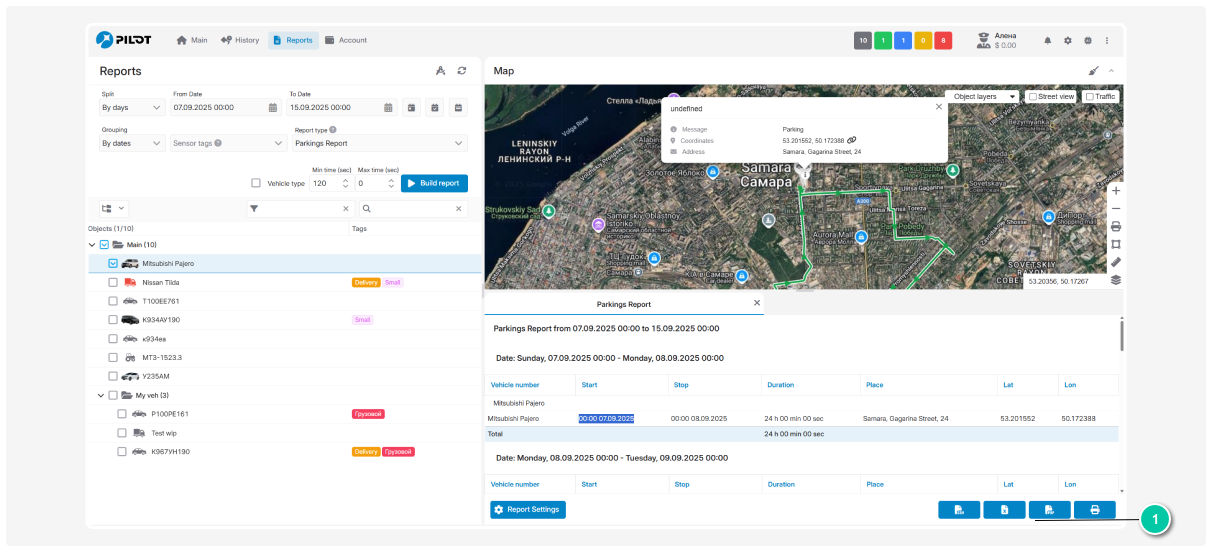
In Parkings reports, choose a record and a stop marker will appear on the map. Click it to view detailed information about the parking.
Marker on map
When you finish working with the map, click Clear  in the upper-right corner of the map to remove all displayed data.
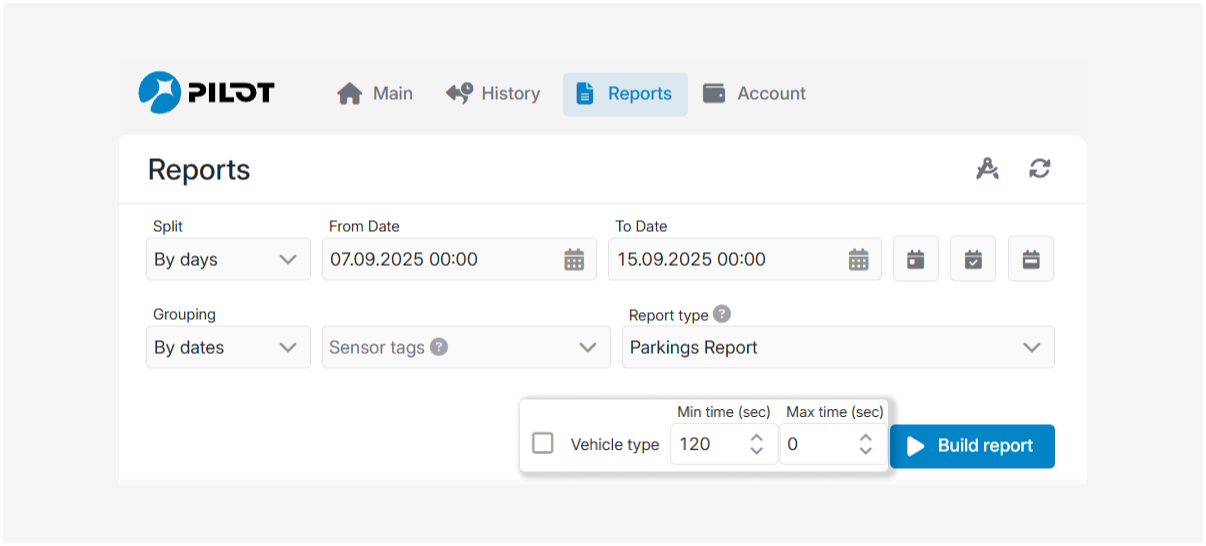
Some reports support additional parameters. They help you display more data or filter results right when building the report. The set of parameters depends on the selected report type.
Where to set parameters:
-
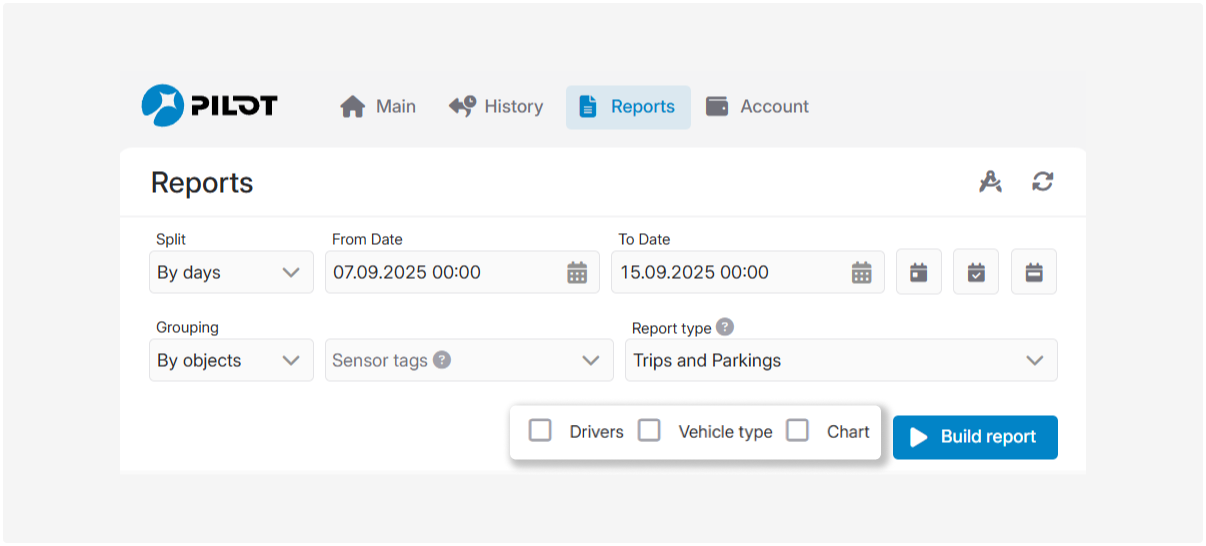
Open the Reports tab and select the report type
2. A block with additional settings will appear below. Set the needed parameters and click Build report
Types of parameters:
-
Toggles (checkboxes)
These enable or hide extra columns and report elements. To display information — check the box. To hide it — clear the box.
For example, in the Trips and parkings report, additional parameters are available: columns with drivers, vehicle type, and a chart.
If no parameters are selected, the report is built with default settings.
|
-
Numeric parameters
These are used for filtering by values and setting ranges. Enter numbers; the measurement units are shown next to the field (sec, min, temperature, etc.).
If the upper threshold is not needed, in some reports you can leave it empty or set it to 0.
For example, in the parking report, you can specify Minimum time (sec) and, if needed, Maximum time (sec) that will be counted as parking.
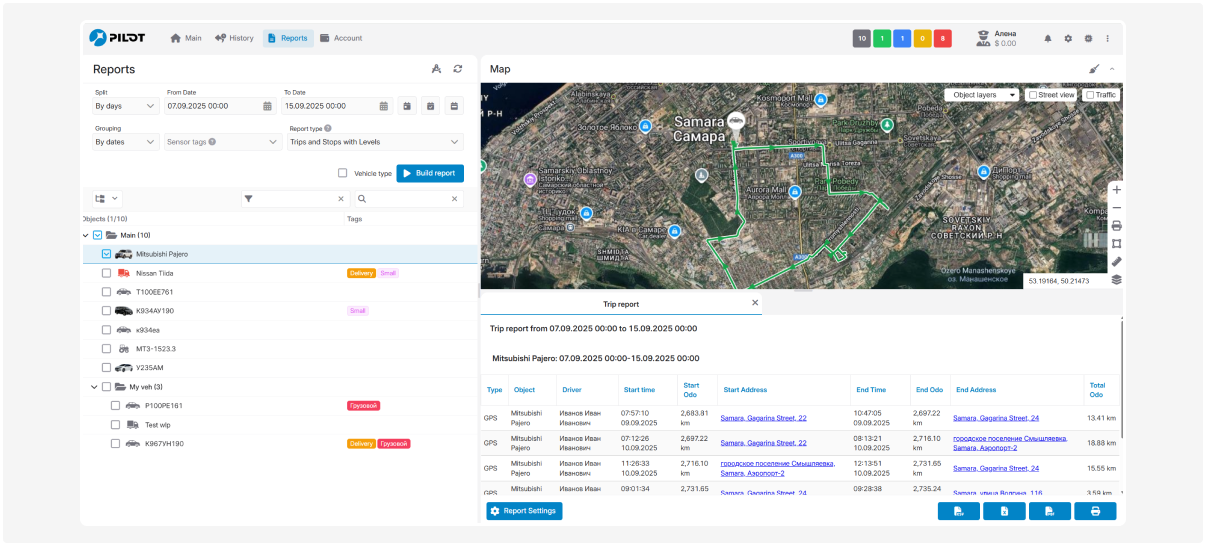
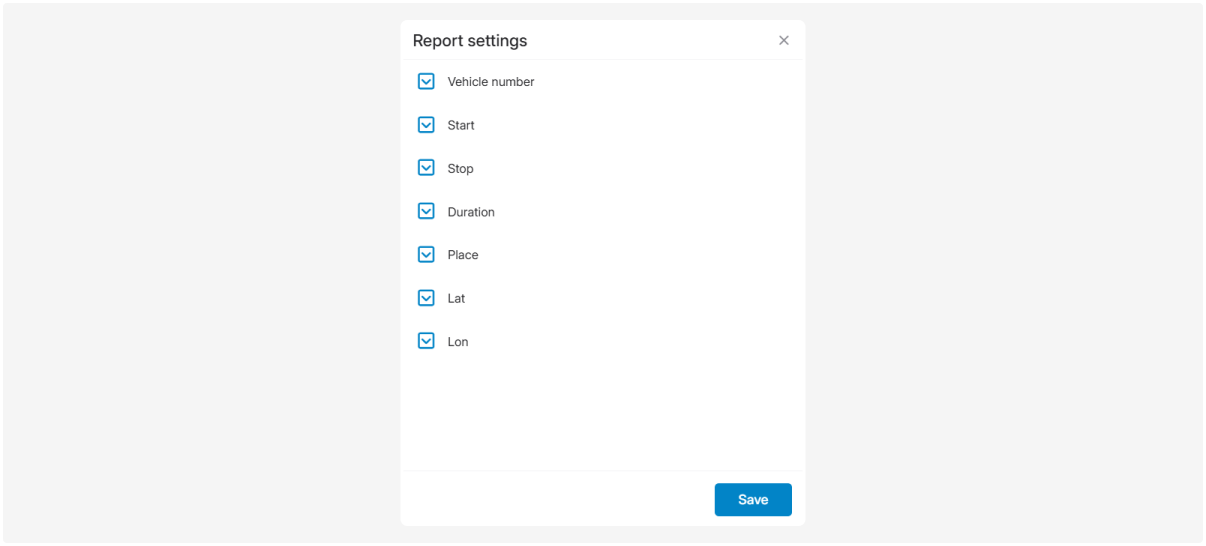
Most reports can be customized:
-
After building the report, click Report settings
2. Check the boxes for the parameters you need — for example, object, geofences, sensors, etc.
3. Click Build report again to refresh the report with your selected parameters
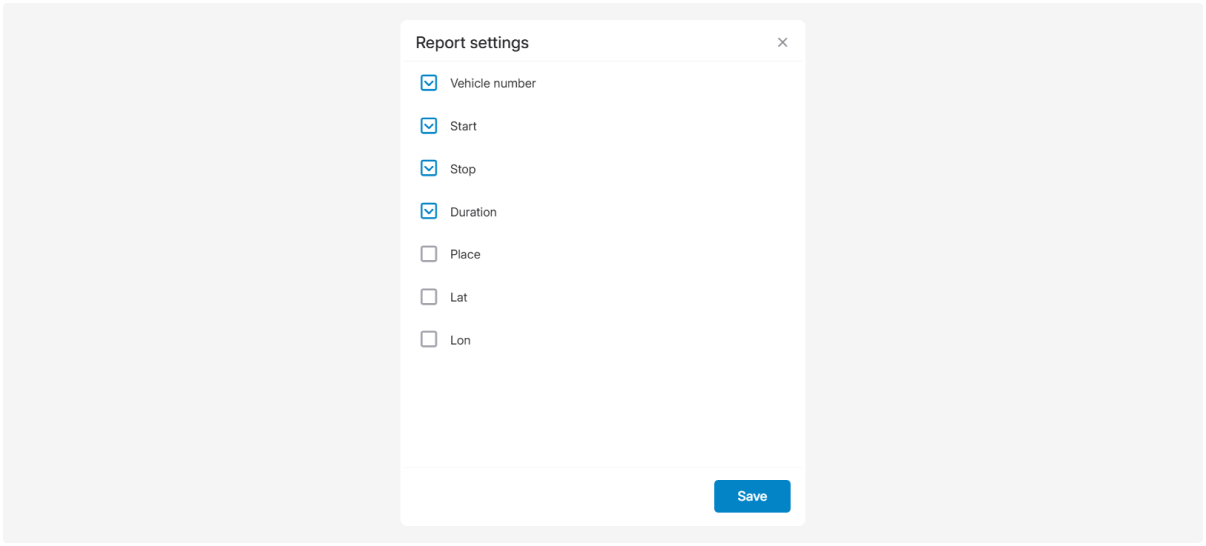
Example
In the Parkings report, all parameters are shown by default.
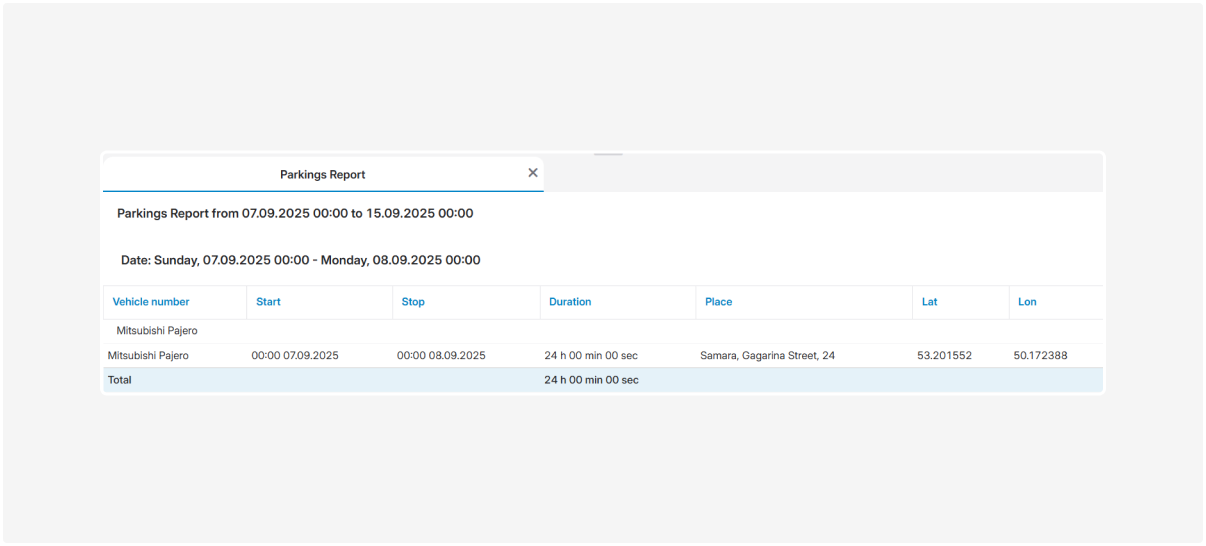
But you can choose specific settings to get a report only for the parameters you need. This way, you only see the information that matters to you.
You can save a finished report in a convenient format — CSV, Excel, or PDF — or send it directly to print for further use.
Report scheduler
Use the report scheduler to set up automatic delivery of reports to your email.
The report scheduler is a tool that automatically sends reports according to a schedule.
How the report scheduler works:
-
Choose which reports you want
-
Select the time when you want to receive them
-
Reports will automatically arrive in your email inbox
For more details on setting up the scheduler, see this article.