BRAG report
The BRAG Report is designed to assess driving safety and classify drivers using the BRAG categories. The report was developed with consideration for QatarEnergy requirements for in-vehicle monitoring systems (IVMS).
The system analyzes recorded violations, including speeding, harsh acceleration, harsh braking, harsh cornering, and seat belt violations. Based on these events, each active driver receives a final score and a color category.
Before generating the report, select a period and the required vehicles or vehicle group. The calculation includes drivers for whom data was received during the selected period.
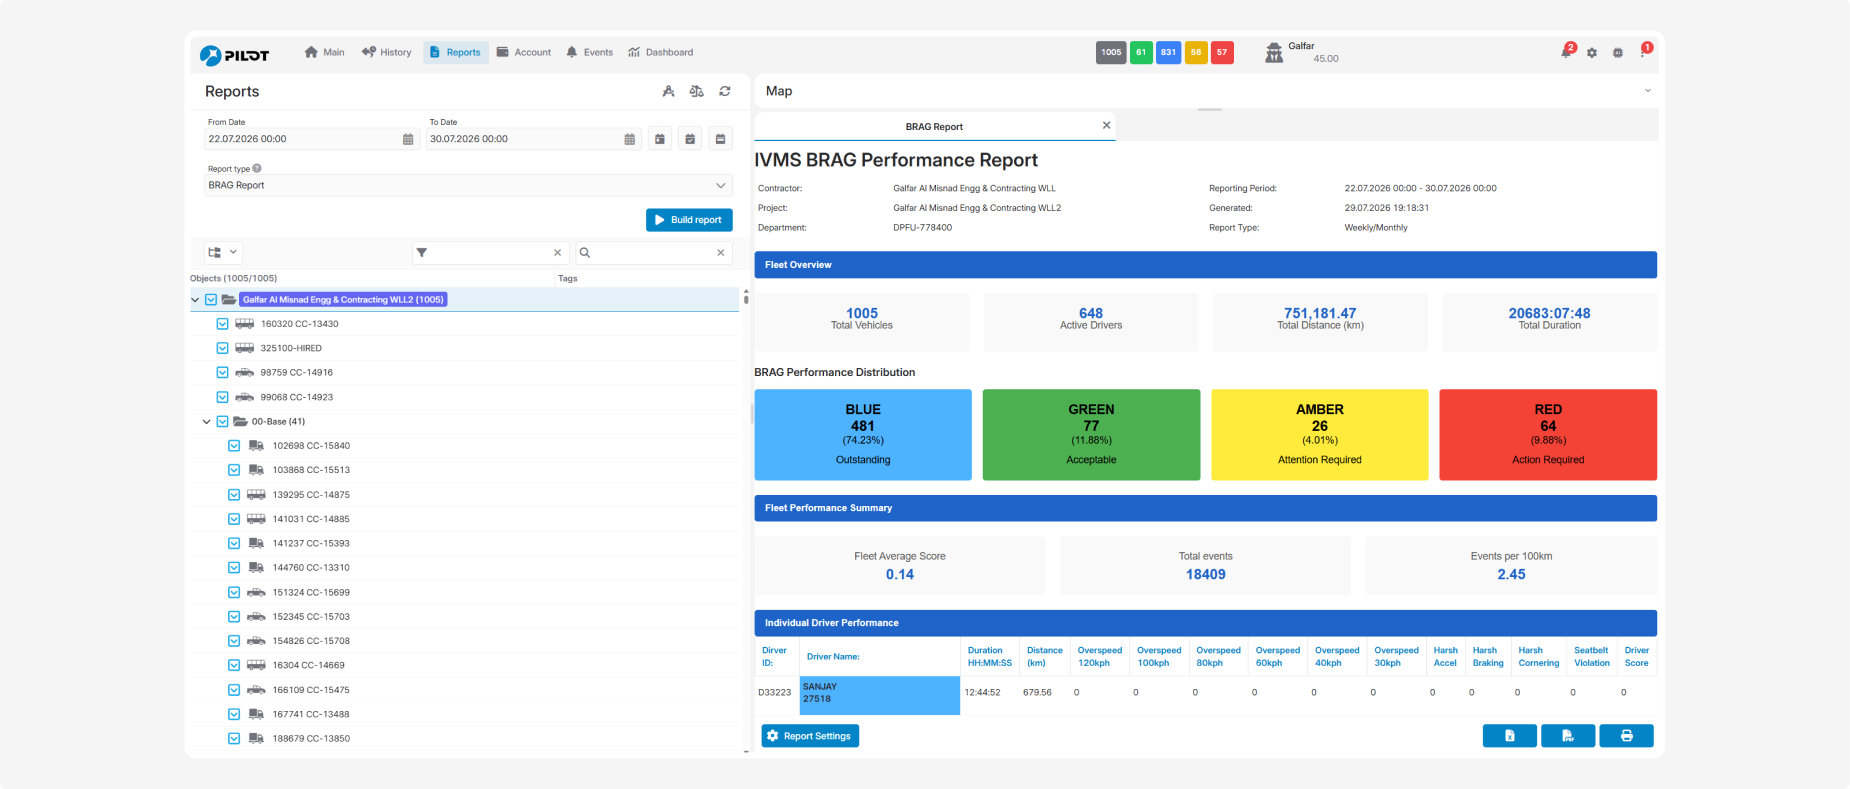
General Information
The top section of the report displays:
-
Contractor — the contractor’s name
-
Project — the project name
-
Department — the department for which the report was generated
-
Report Period — the start and end of the analyzed period
-
Generated — the date and time when the report was generated
-
Report Type — the report type, for example, Weekly/Monthly

Fleet Overview
The Fleet Overview section provides general information about the fleet:
-
Total Vehicles — the total number of selected vehicles
-
Active Drivers — the number of drivers with recorded activity during the selected period
-
Total Distance (km) — the total distance traveled by the vehicles
-
Total Duration — the total vehicle operating time
The number of active drivers may be lower than the number of vehicles. The BRAG distribution includes only drivers for whom the system received the required data.
BRAG Performance Distribution
The BRAG Performance Distribution section divides active drivers into four categories. Each category shows the number of drivers and their percentage of all active drivers:
-
BLUE — Outstanding — outstanding driving performance
-
GREEN — Acceptable — acceptable driving performance
-
AMBER — Attention Required — driving performance requires attention
-
RED — Action Required — corrective action is required
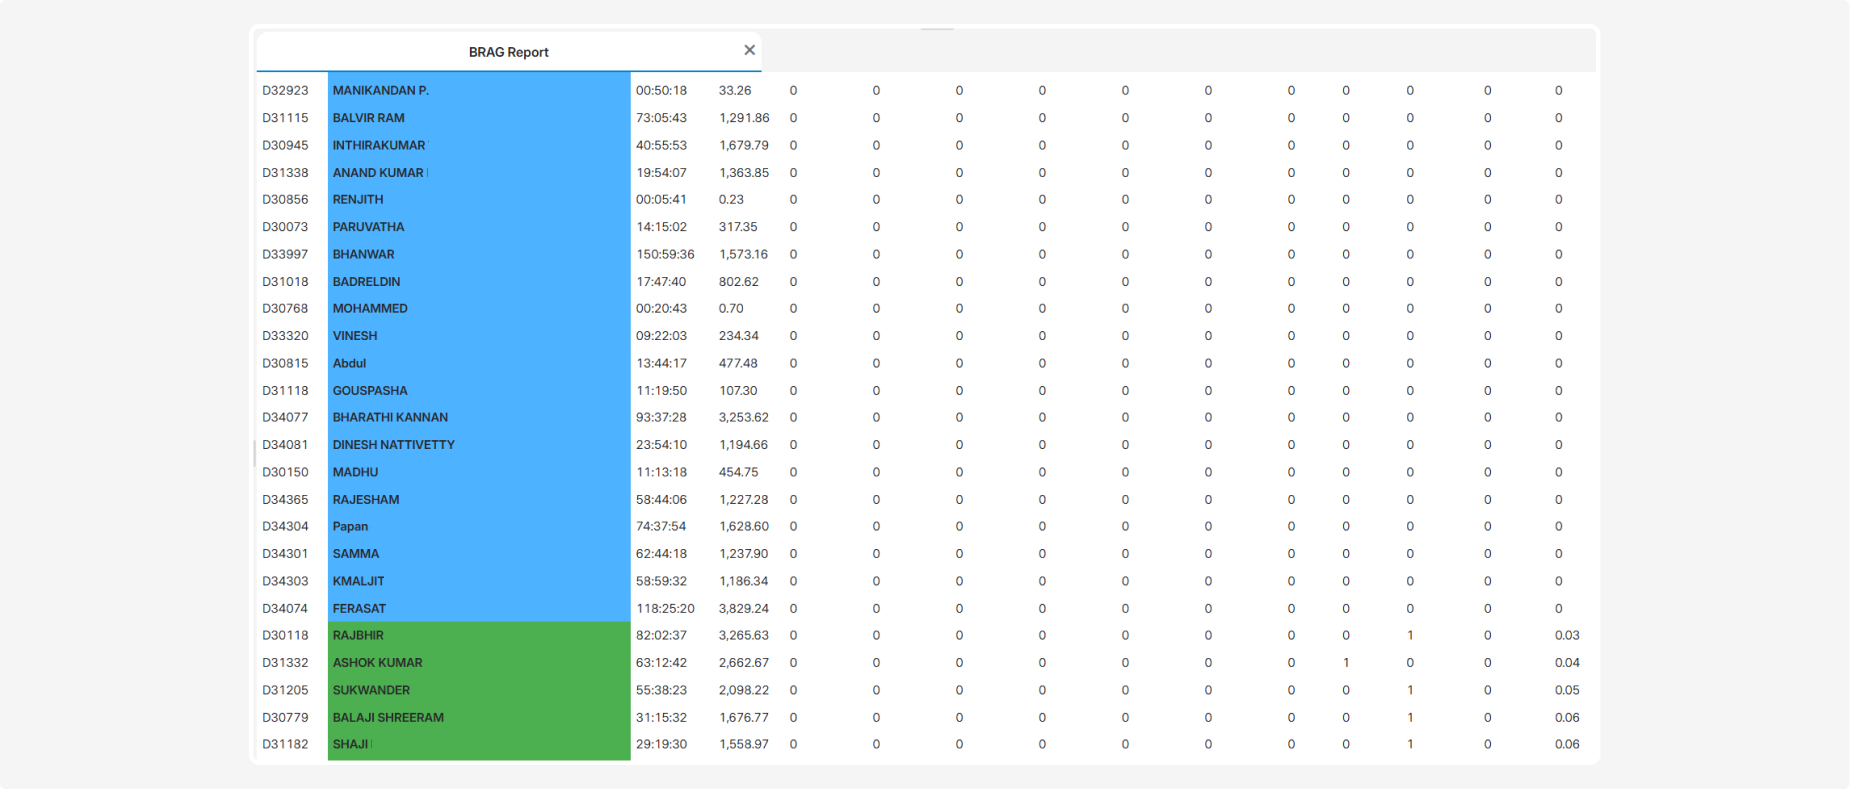
The same colors are used to highlight driver names in the detailed table:
-
blue — BLUE category
-
green — GREEN category
-
amber — AMBER category
-
red — RED category
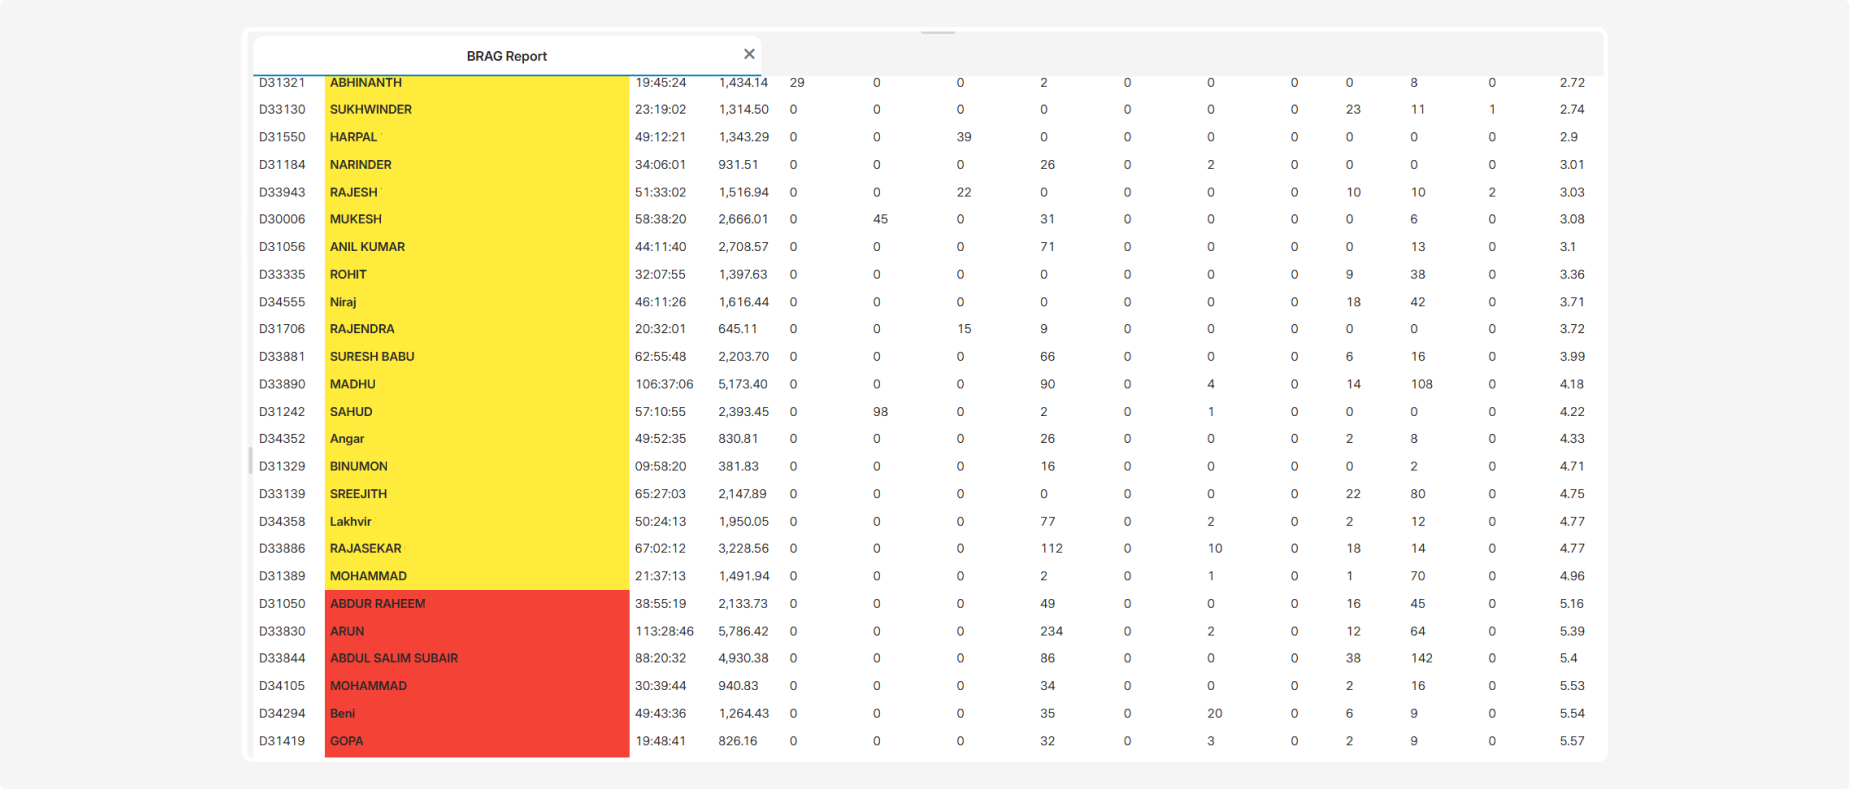
A higher final score and a greater number of violations indicate that the driver’s performance requires more attention.
Fleet Performance Summary
The Fleet Performance Summary section provides summarized performance indicators for the selected fleet:
-
Fleet Average Score — the average final score for the fleet’s drivers
-
Total Events — the total number of recorded events and violations
-
Events per 100 km — the average number of events per 100 km traveled
The Events per 100 km indicator allows you to compare drivers and departments with different total distances.
Individual Driver Performance
The Individual Driver Performance section provides detailed results for each driver.
The table displays:
-
Driver ID — the driver’s identifier
-
Driver Name — the driver’s name
-
Duration HH:MM:SS — the driver’s total operating time
-
Distance (km) — the total distance traveled
-
Overspeed 120 kph — the number of speeding events in the 120 kph category
-
Overspeed 100 kph — the number of speeding events in the 100–119 kph range
-
Overspeed 80 kph — the number of speeding events in the 80–99 kph range
-
Overspeed 60 kph — the number of speeding events in the 60–79 kph range
-
Overspeed 40 kph — the number of speeding events in the 40–59 kph range
-
Overspeed 30 kph — the number of speeding events in the 30–39 kph range
-
Harsh Acceleration — the number of harsh acceleration events
-
Harsh Braking — the number of harsh braking events
-
Harsh Cornering — the number of harsh cornering events
-
Seatbelt Violation — the number of seat belt violations
-
Driver Score — the driver’s final score used to determine their BRAG category
Preparing data for the report
The report obtains violation data from notifications configured for the vehicles. Before using the report, create the required notifications and assign them to the appropriate vehicles.
The algorithm identifies each event type by its notification name. Notification names must exactly match the approved naming convention:
-
BRAG Harsh Braking
-
BRAG Harsh Acceleration
-
BRAG Harsh Cornering
-
BRAG Overspeed
-
BRAG Overspeed 30-39
-
BRAG Overspeed 40-59
-
BRAG Overspeed 60-79
-
BRAG Overspeed 80-99
-
BRAG Overspeed 100-119
-
BRAG Overspeed 120
-
BRAG Seatbelt Violation
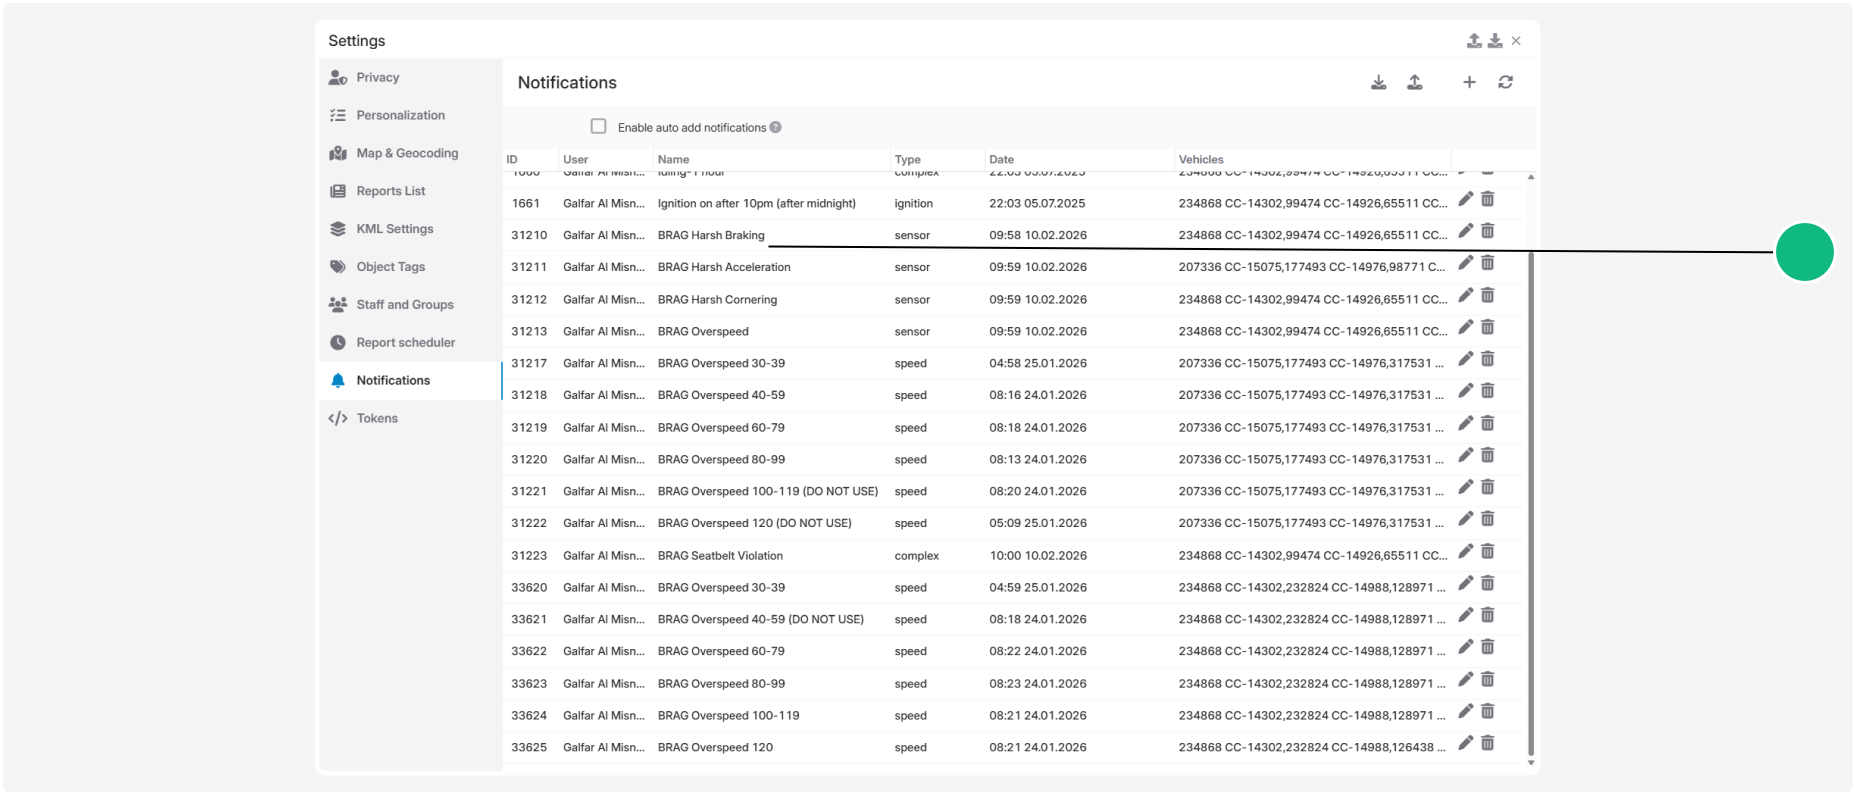
Assign the notifications to every vehicle whose data must be included in the report.
If a notification is missing, assigned to the wrong vehicle, or its name does not exactly match the required convention, the algorithm may not recognize the event. As a result, the violation will not appear in the report, and the final performance indicators may be calculated incorrectly.