Dashboard
In the Dashboard tab of the Service module, you can:
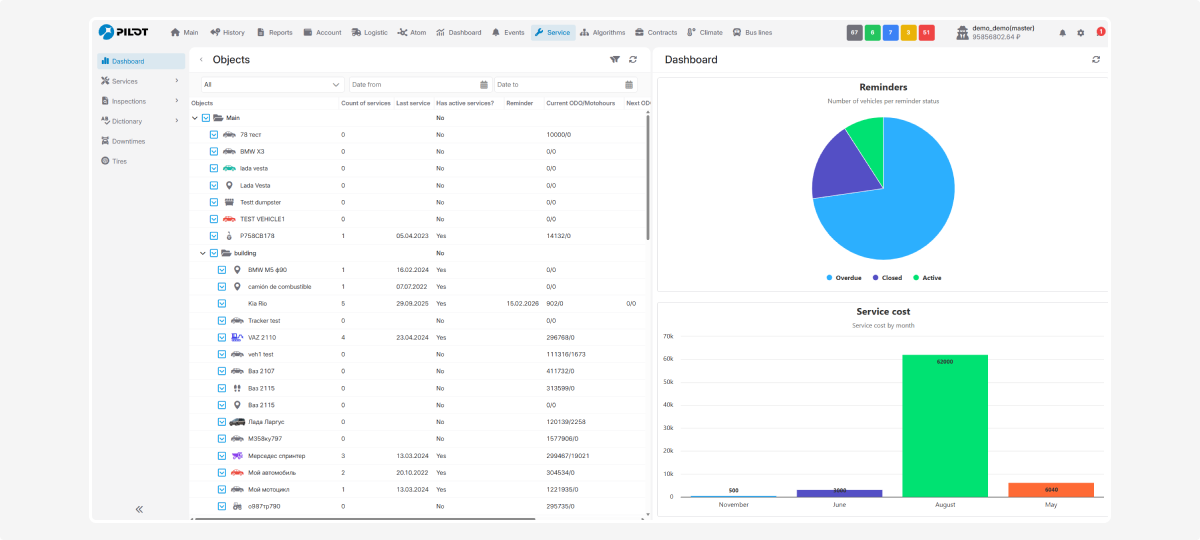
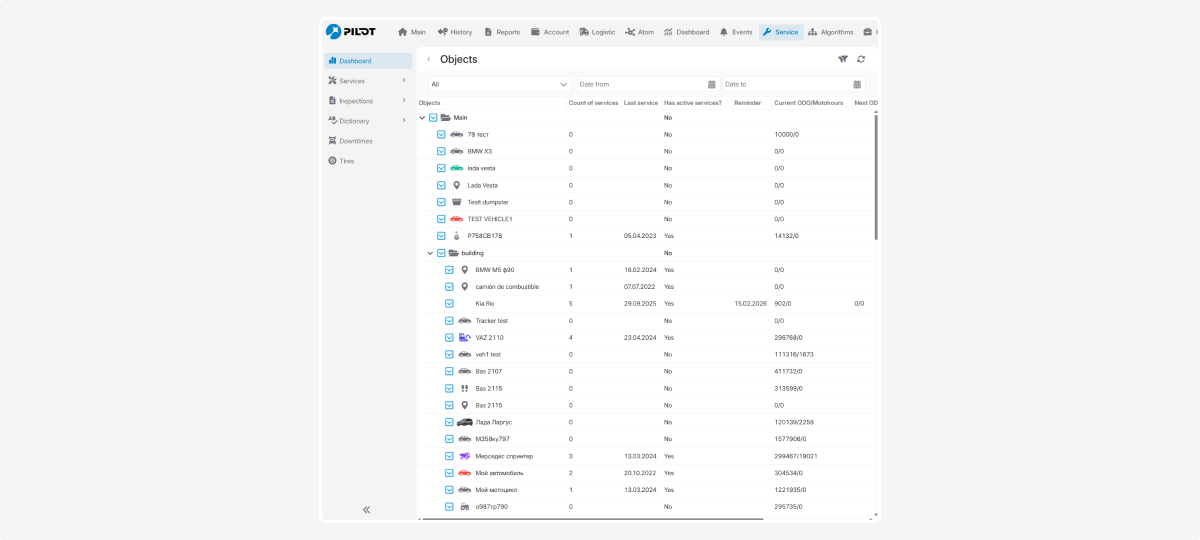
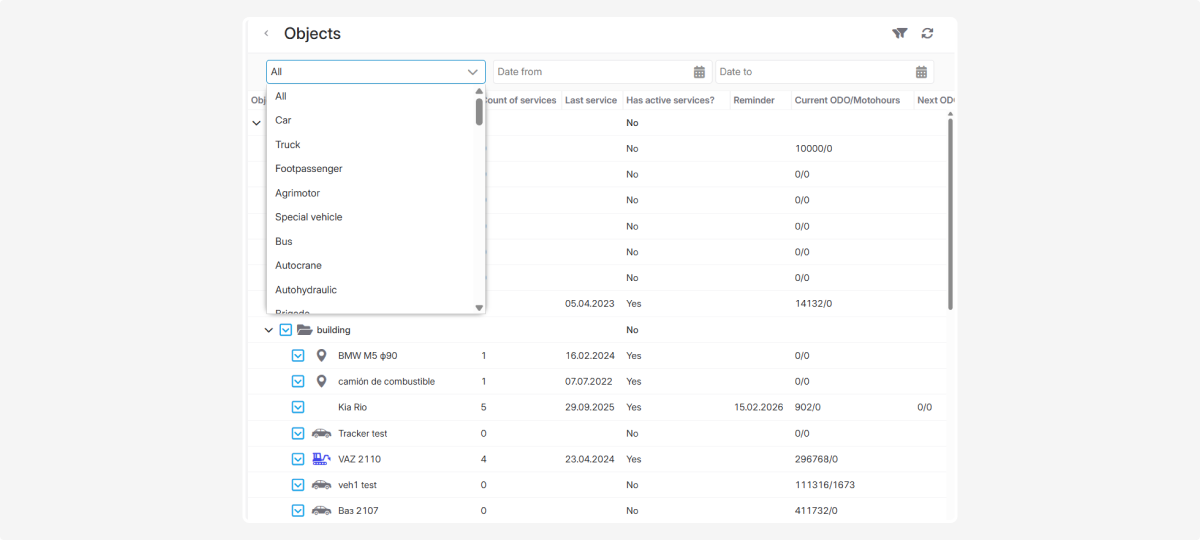
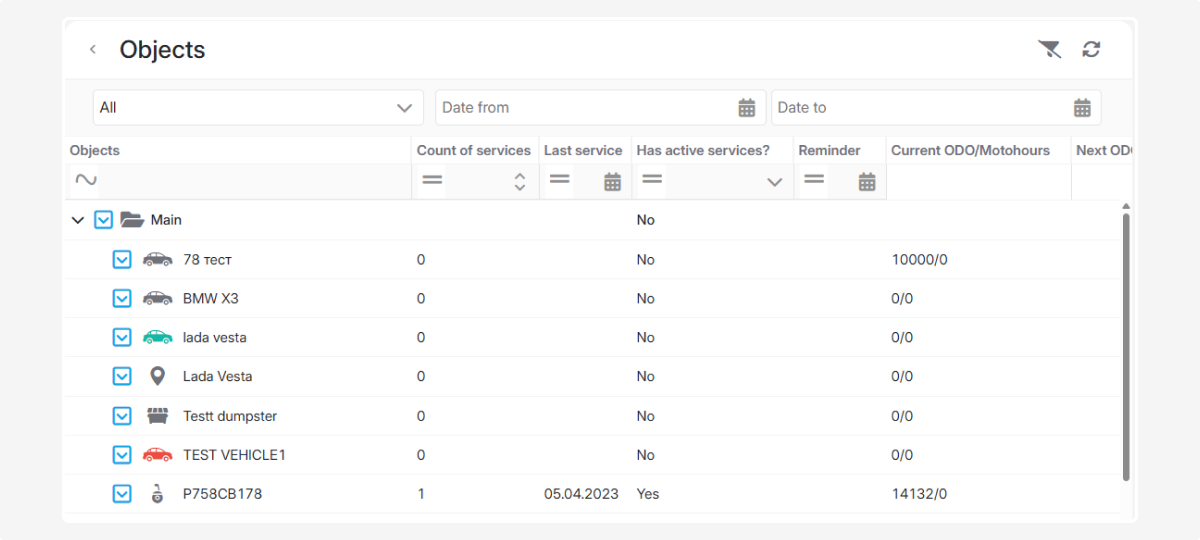
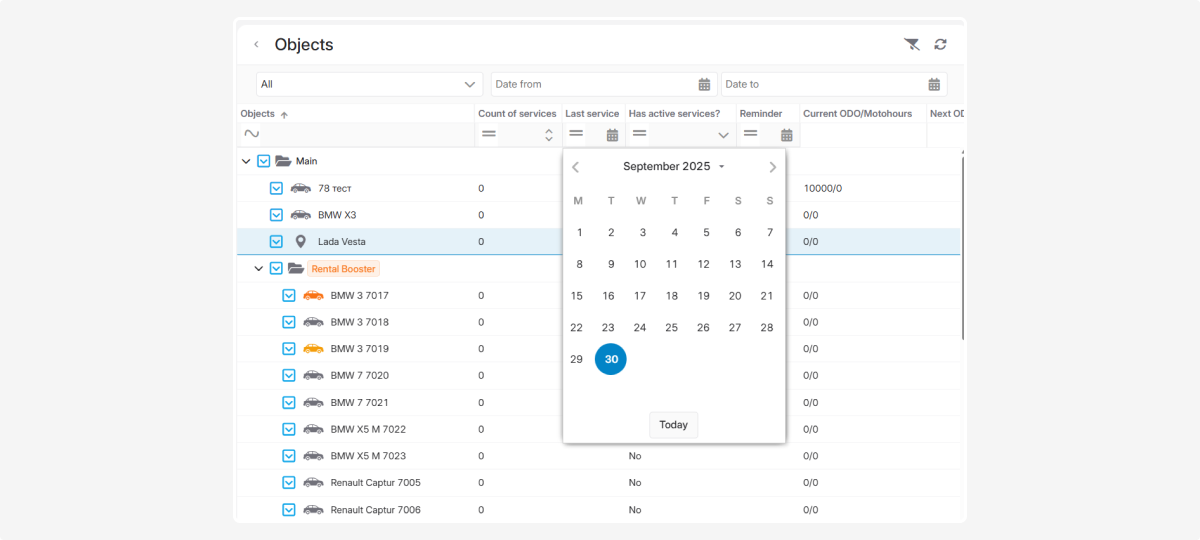
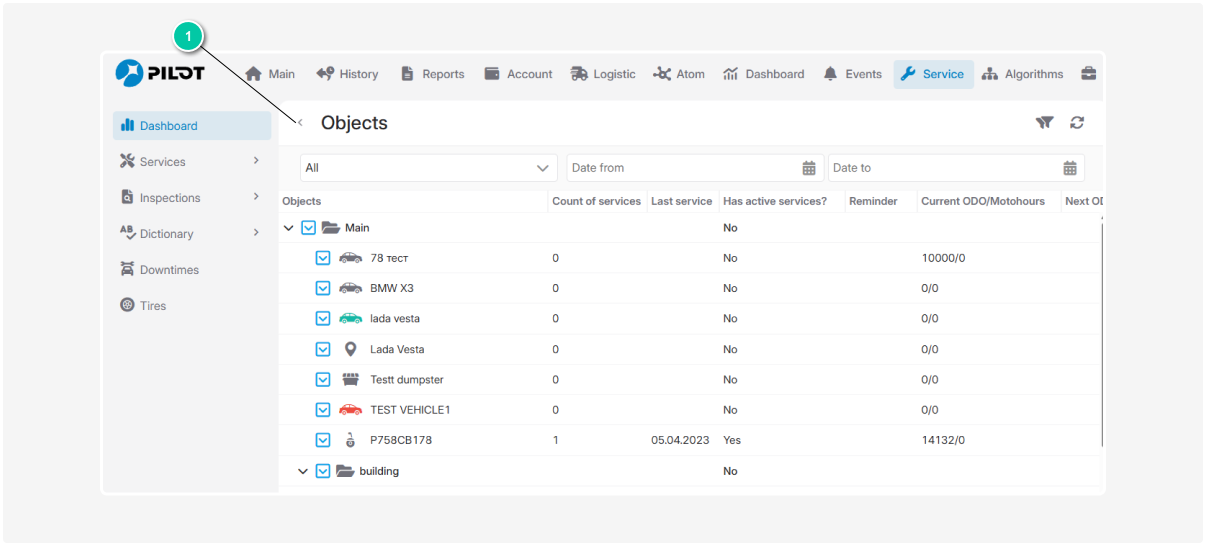
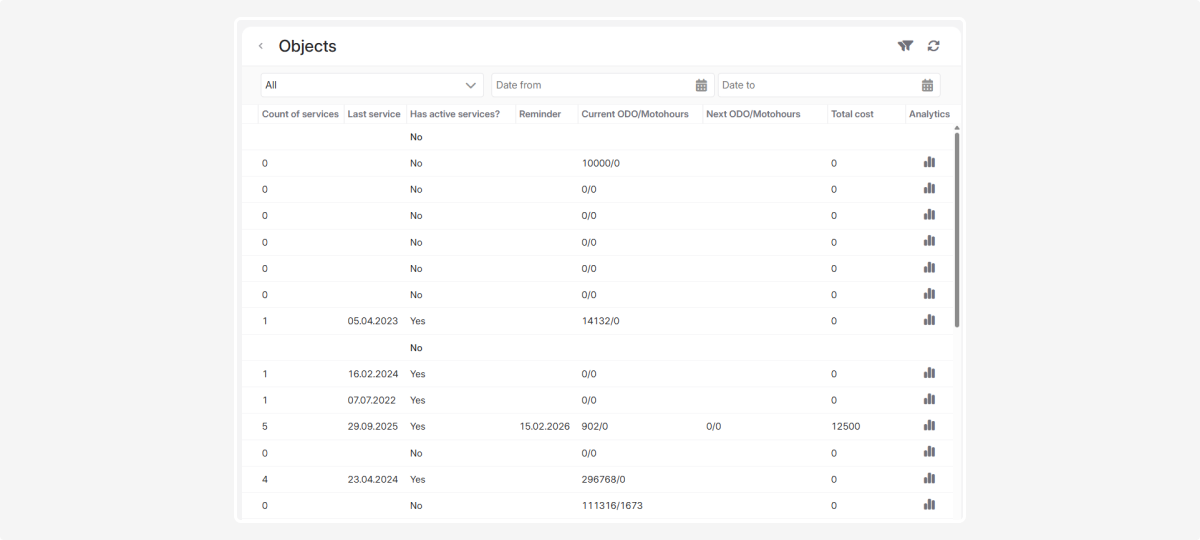
The Objects list shows data for each vehicle:
-
Number of completed services
-
Date of the last service
-
Whether the service is currently active
-
Next service reminder
-
Current mileage
-
Mileage left until the next service
-
Total service cost
-
Quick access to the object’s analytics
You can customize the visible columns in the list and use filters for convenient searching.
How to configure the Objects list:
1. Click the arrow  in the header of any column — a menu will appear
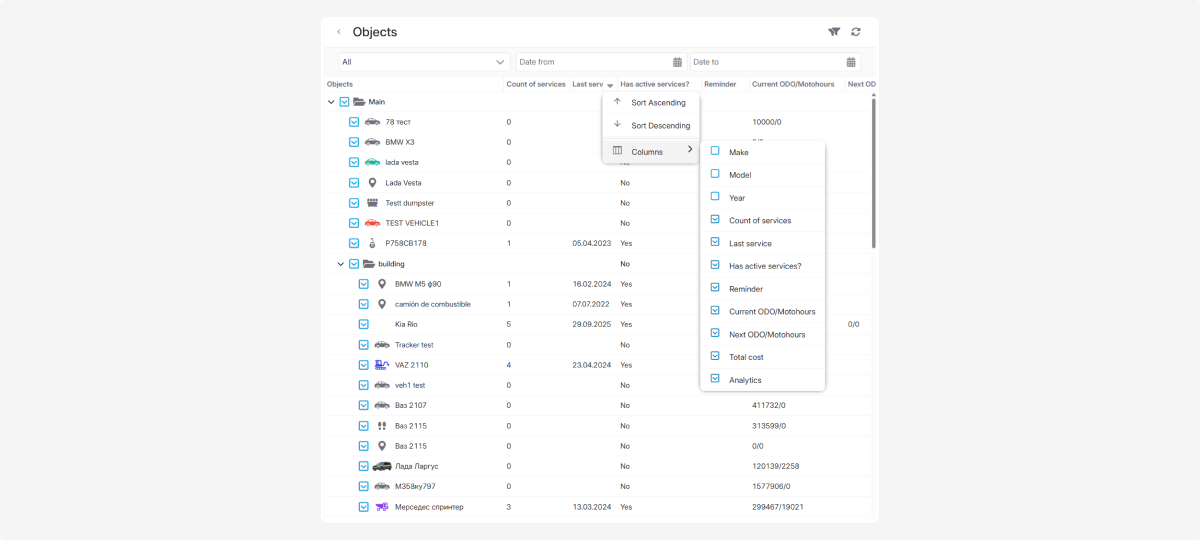
2. In the menu, you can:
-
Sort the data in ascending or descending order
-
Select which columns to display
-
Click Columns — a list of available parameters will open
-
Check the boxes next to the parameters you want to see
Filters allow you to display only the objects you need.
1. Configure a filter by object type — for example, view only passenger cars or special equipment
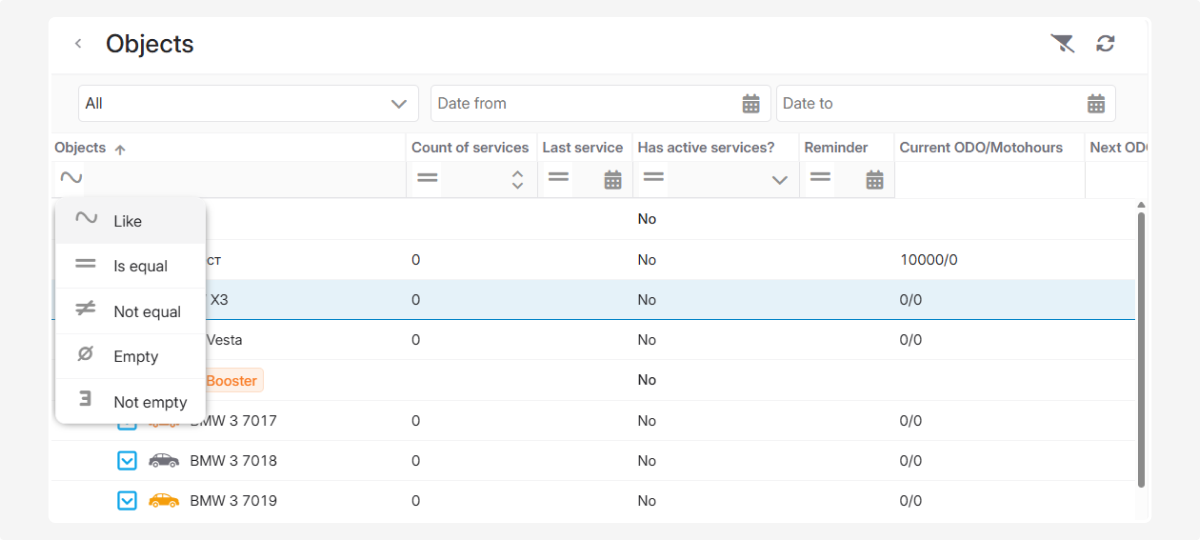
4. You can filter by conditions:
-
Contains
-
Equals
-
Not equal
-
Empty / Not empty
-
Greater than / Greater than or equal
-
Less than / Less than or equal
Examples
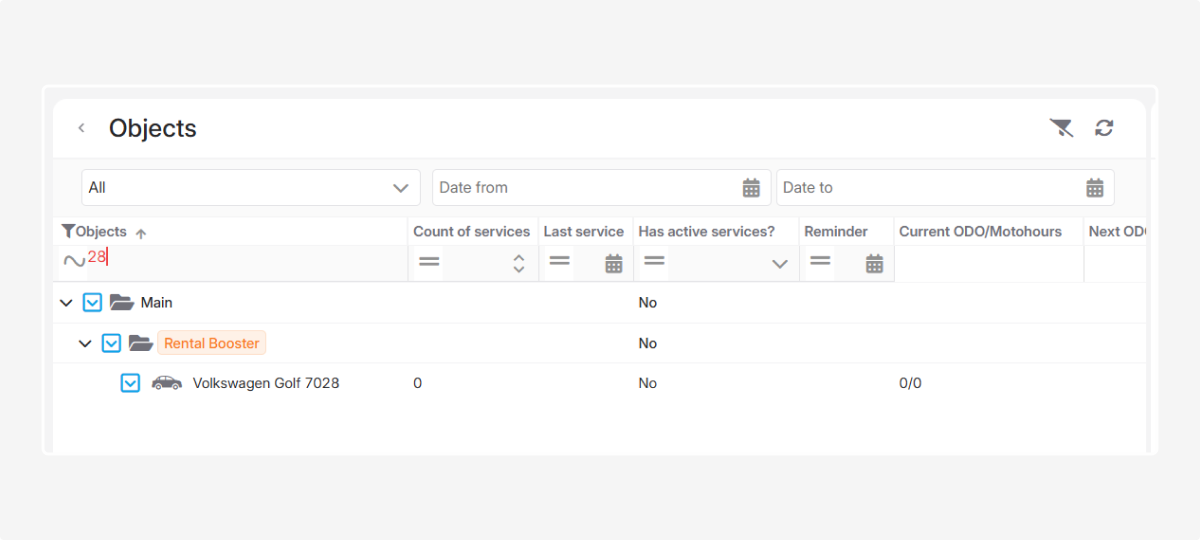
In the Objects column, choose the Contains filter and enter part of a name — all matching objects will be shown.
In the Last service column, choose the Equals filter and specify a date (manually or from the calendar) — all objects serviced on that day will be displayed.
To refresh the objects list, click the Refresh button  .
.
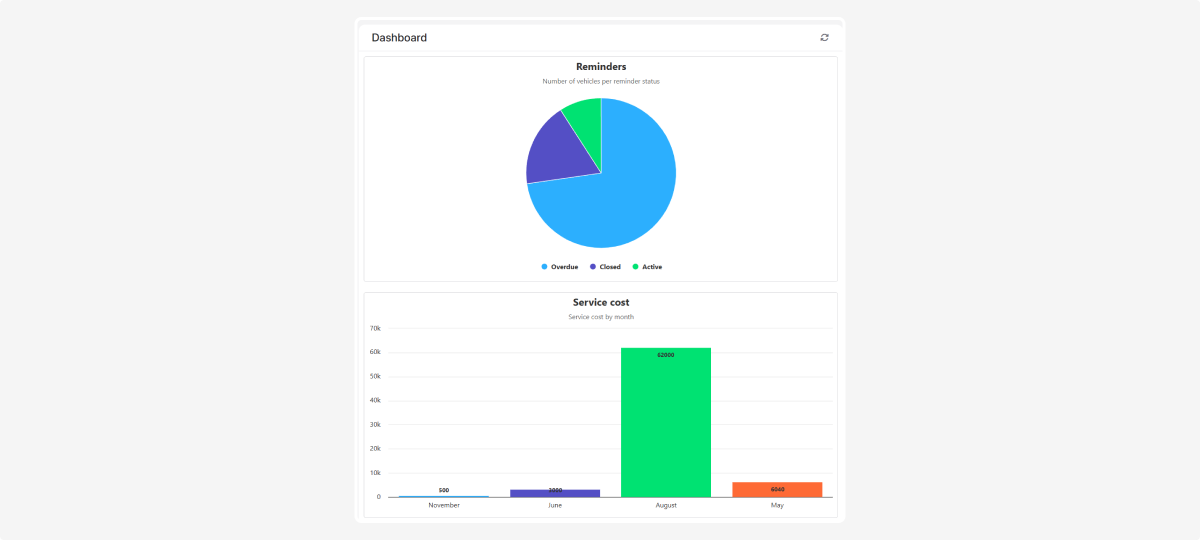
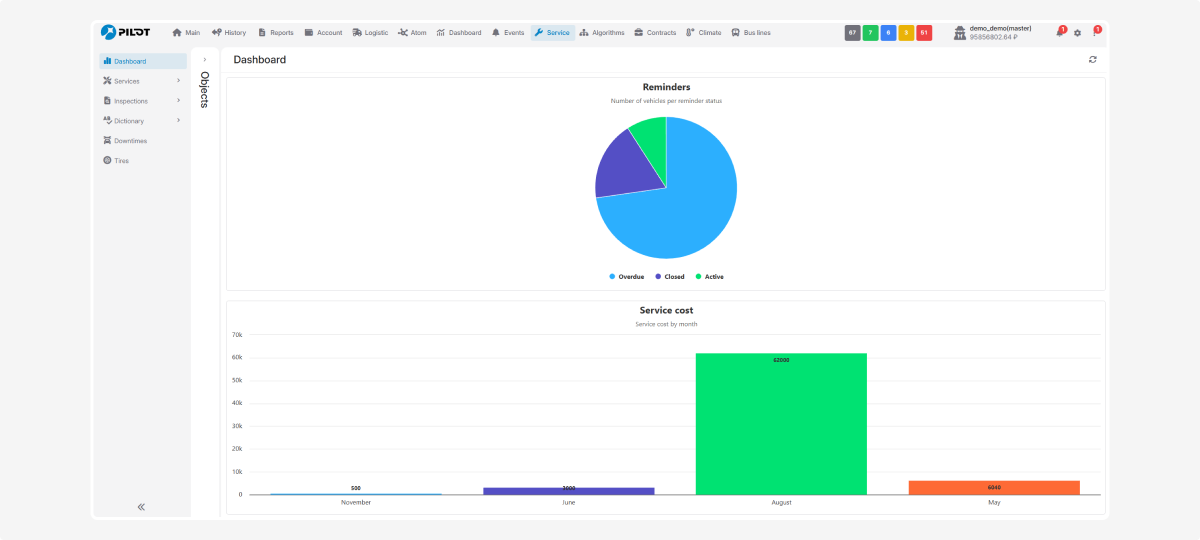
The dashboard is a screen with visual data in the form of charts and diagrams.
How to use the dashboard:
1. Expand the dashboard to full screen for focused analysis
-
Find the Expand dashboard button

-
Click it — the dashboard will open in full-screen mode
-
To exit full screen, click the button again
 2. To refresh the data in the charts, click the Refresh button
The dashboard includes:
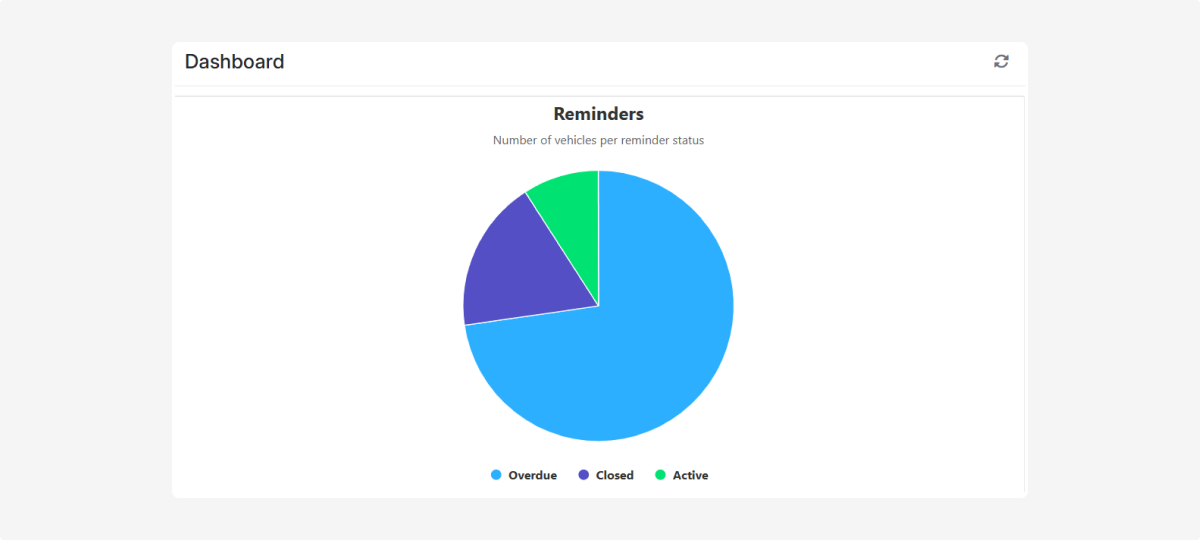
— Active
— Overdue
— Closed
— Due soon
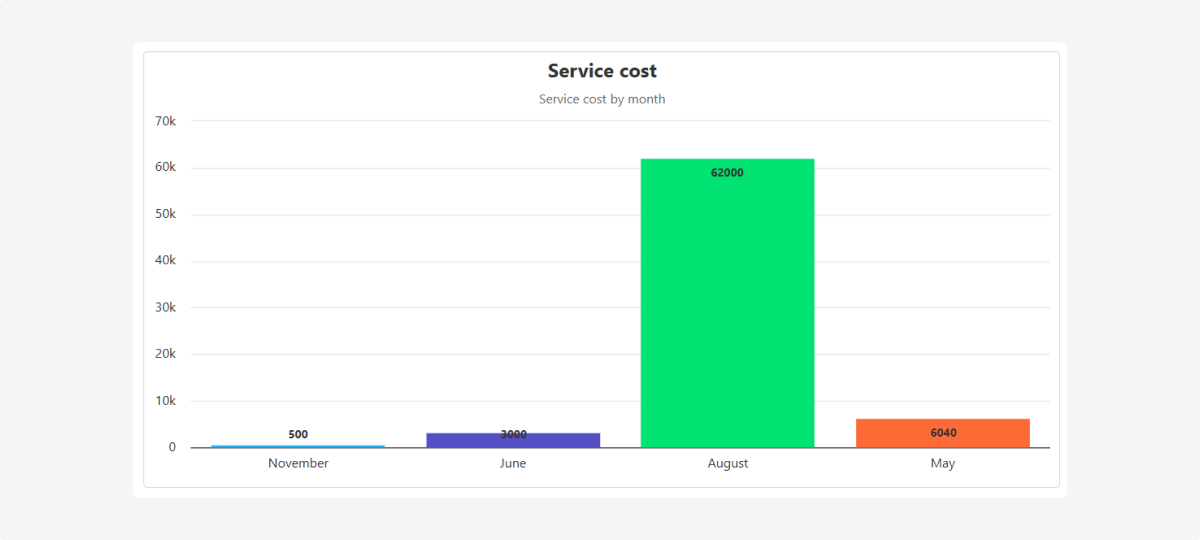
-
A chart with service costs, showing monthly maintenance expenses.
To view analytics for a specific object:
1. Find the Analytics column in the objects list
2. Click the graph icon
You will be taken to detailed analytics, where you can calculate:
-
Lifecycle cost estimation
-
Service cost estimation
-
Fuel cost estimation
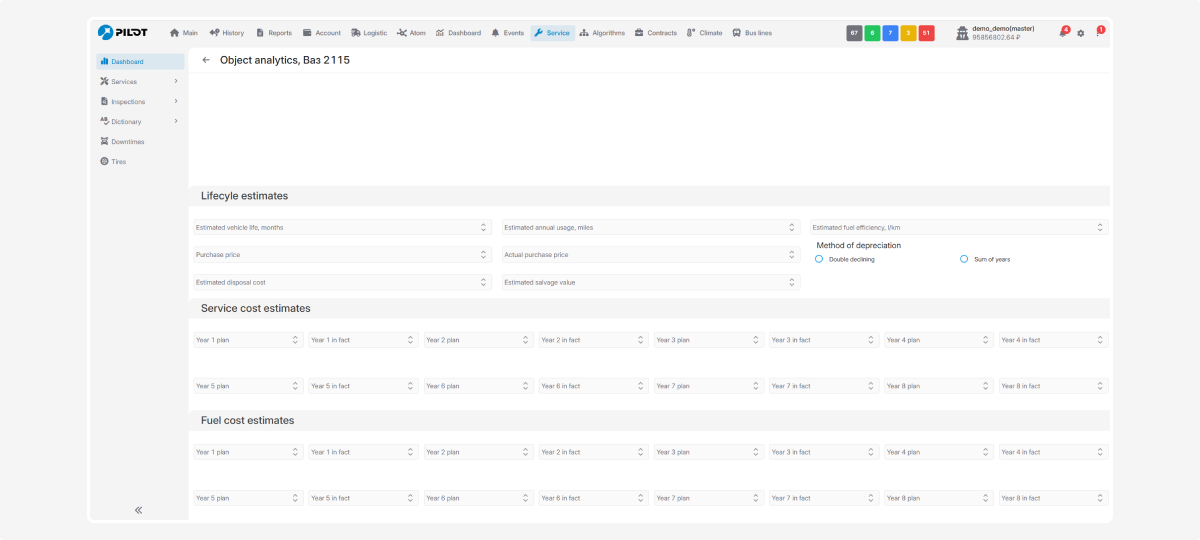
In object analytics, you control the data and adjust parameters as needed. Changes are reflected instantly in the calculations.
The graph shows how the total cost of ownership changes over time by year.
All data in the graph is calculated based on the values you enter in the following sections:
-
Lifecycle estimation
-
Service cost estimation
-
Fuel cost estimation
When these parameters are updated, the graph recalculates automatically.
What the graph shows:
-
Bars represent yearly expenses:— maintenance costs— fuel costs— planned and actual values
-
TCO line shows the total cost of ownership for each year
-
Depreciation curve helps you see how the asset’s value decreases over time
-
Cost per km shows the average cost per kilometer, both planned and actual
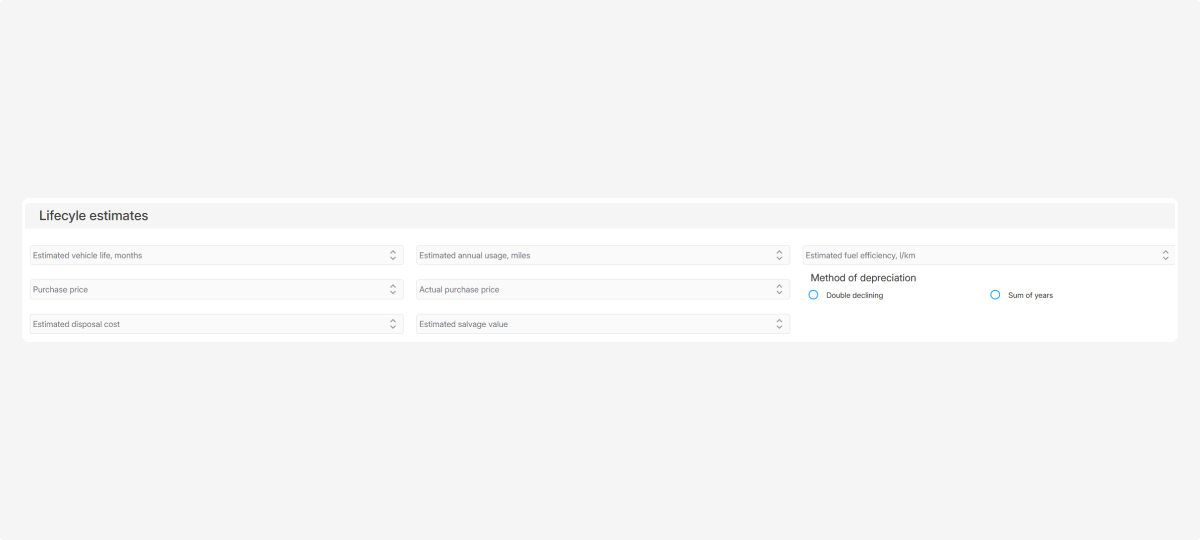
Lifecycle estimation
Fill in the following fields:
-
Estimated vihicle life (in months): e.g., 60 months for a car
-
Purchase price: the amount you planned to spend
-
Estimated disposal cost: expected cost of disposal or decommissioning at the end of service life
-
Estimated annual mileage (miles): for example, how many miles a car drives per year
-
Actual purchase price: the real amount paid
-
Estimated salvage value: the expected value at the end of its service life
-
Estimated fuel efficiency (L/km): how many liters of fuel are consumed per kilometer.
Depreciation methods
Choose the depreciation method suitable for the object:
-
Double-declining balance method:Writes off value faster in early years. Applies double the straight-line depreciation rate to the remaining book value.Example:Car price: $10,000Service life: 5 yearsStraight-line rate = 1/5 = 20%Double-declining rate = 40%Year 1: 10,000 × 40% = $4,000Year 2: (10,000 – 4,000) × 40% = $2,400This method is used for assets that lose value quickly or provide more utility early in their lifecycle.
-
Sum-of-years-digits method:A smoother depreciation method compared to accelerated. First, sum all years of useful life, then calculate yearly fractions.Example:Service life: 5 yearsSum of years: 1+2+3+4+5 = 15Year 1: 5/15 of costYear 2: 4/15Year 3: 3/15, etc.This method fits assets with uneven wear but without a sharp value drop.
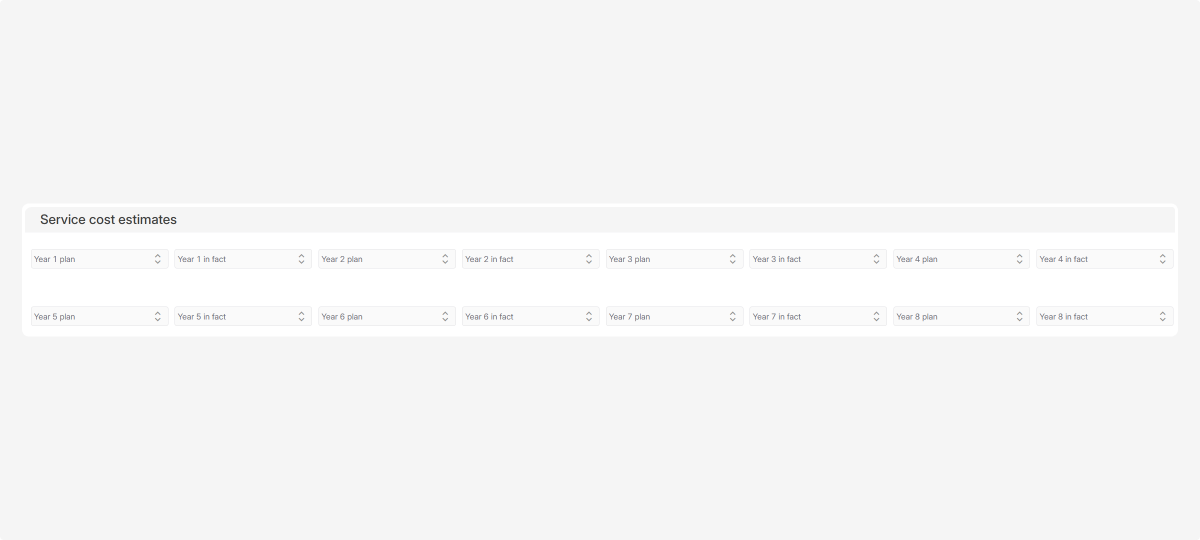
Service cost estimation
Specify planned vs. actual service costs by year to track whether expenses meet expectations.

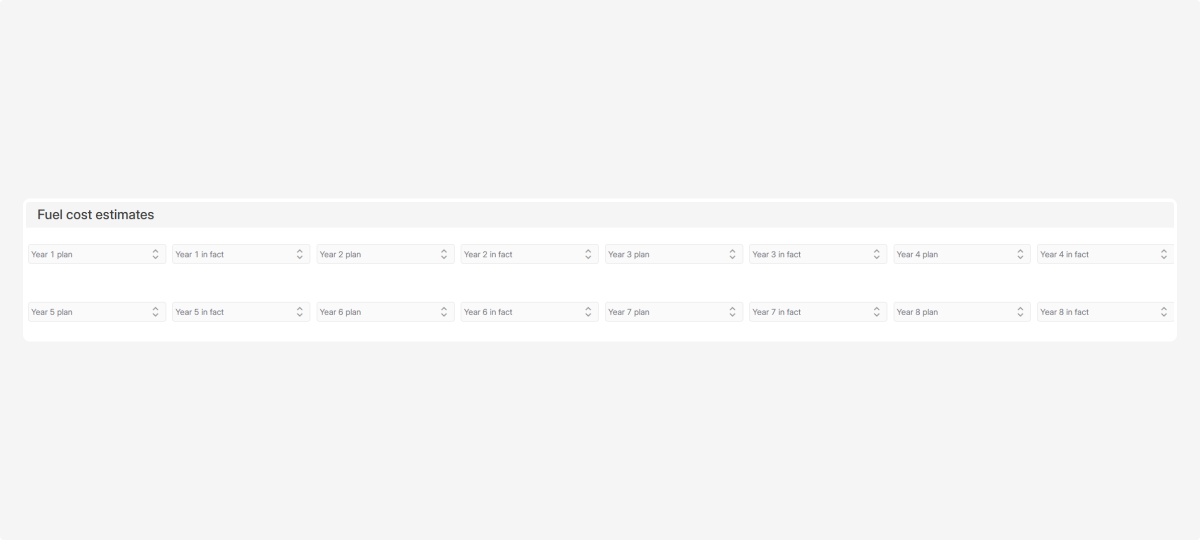
Fuel cost estimation
Similarly, specify planned vs. actual fuel costs for each year.