Smart waste management
The Smart Waste Management report provides information about waste container servicing during the selected period. It helps you assess waste collection activity, identify areas where containers regularly become full, and adjust collection schedules and routes.
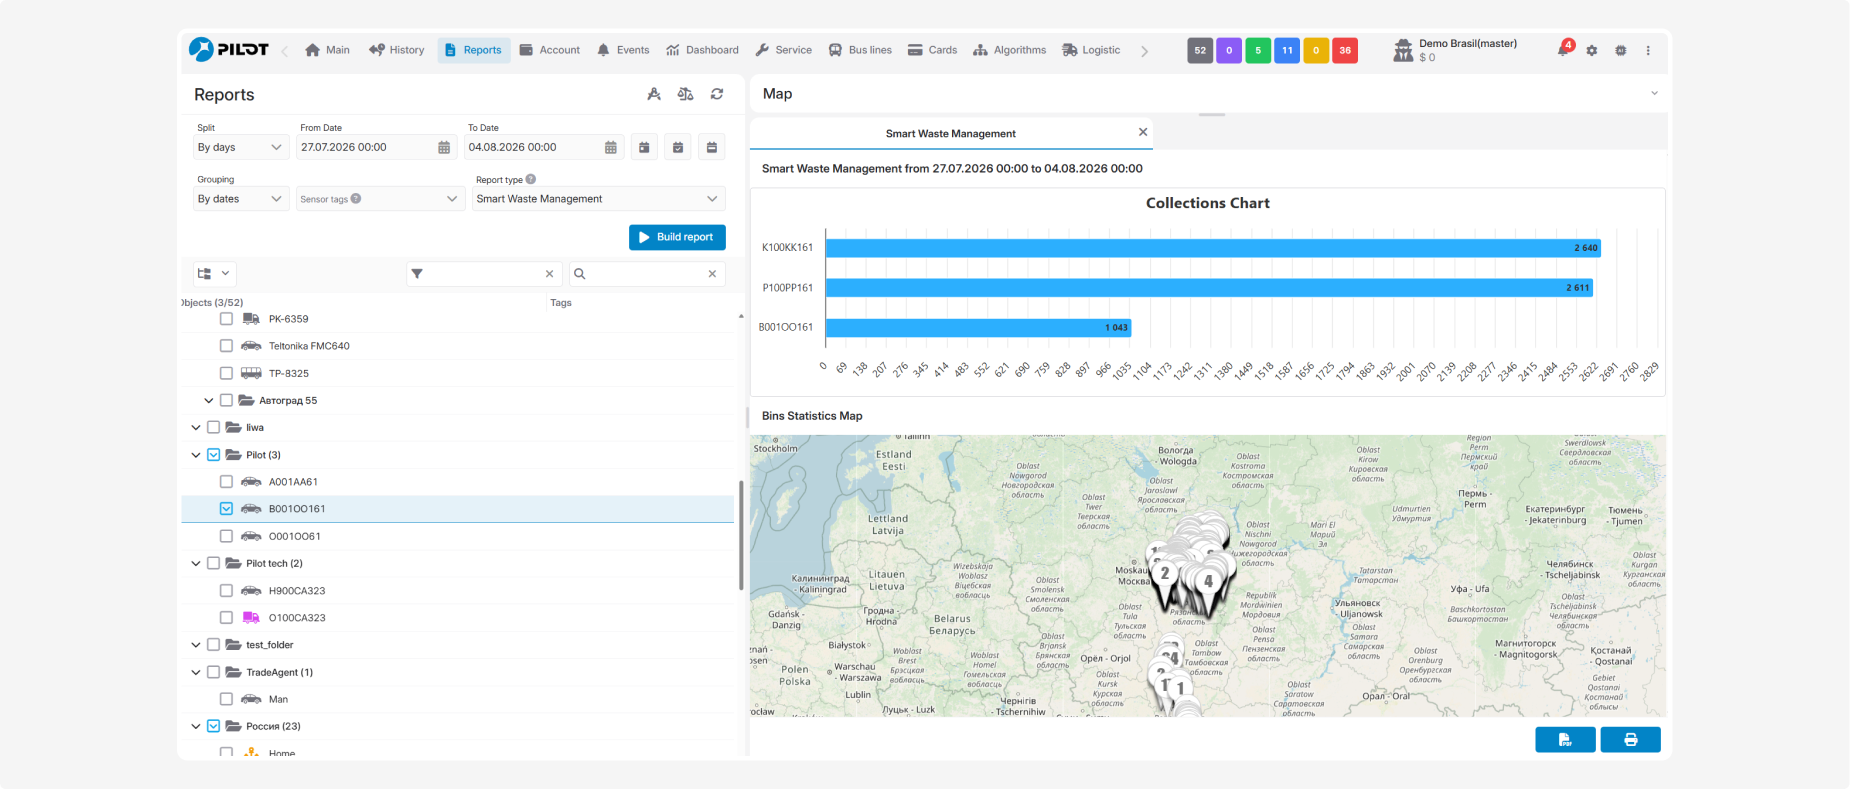
The report consists of two sections.
Collections Chart
The chart shows the number of registered collections for each selected object. Object names or numbers are displayed on the left, while the values on the bars indicate the number of collections during the reporting period.
The chart helps you:
— assess collection activity for each object
— compare the number of collections
— identify objects with high or low workloads
— check compliance with the waste collection schedule

Bins Statistics Map
The map shows the locations where the system registered full waste containers. The number on each marker indicates how many such events occurred at that location.
Select a marker to open the Bins Statistics window, which contains:
• Coordinates — the latitude and longitude of the location
• Address — the address or description of the location
• Total full alerts — the total number of bin-full alerts
• Bin full alerts list — a list of objects for which alerts were registered and the number of events for each object

The map helps identify areas where containers regularly become full or overflow, determine where more frequent collection may be required, and plan vehicle routes based on actual demand.
The report is generated from registered collection events and bin-full alerts. To ensure that the data is displayed correctly, the relevant sensors and alerts must be configured for the selected objects.