Special sensors report
The Special sensors report contains charts showing readings from the sensors of the selected objects for the specified period. It allows you to track changes in parameters over time, identify sudden deviations and periods with missing data, and compare readings from multiple sensors.
A separate set of charts is generated for each selected object. The report contents depend on the equipment and sensors installed on the object.
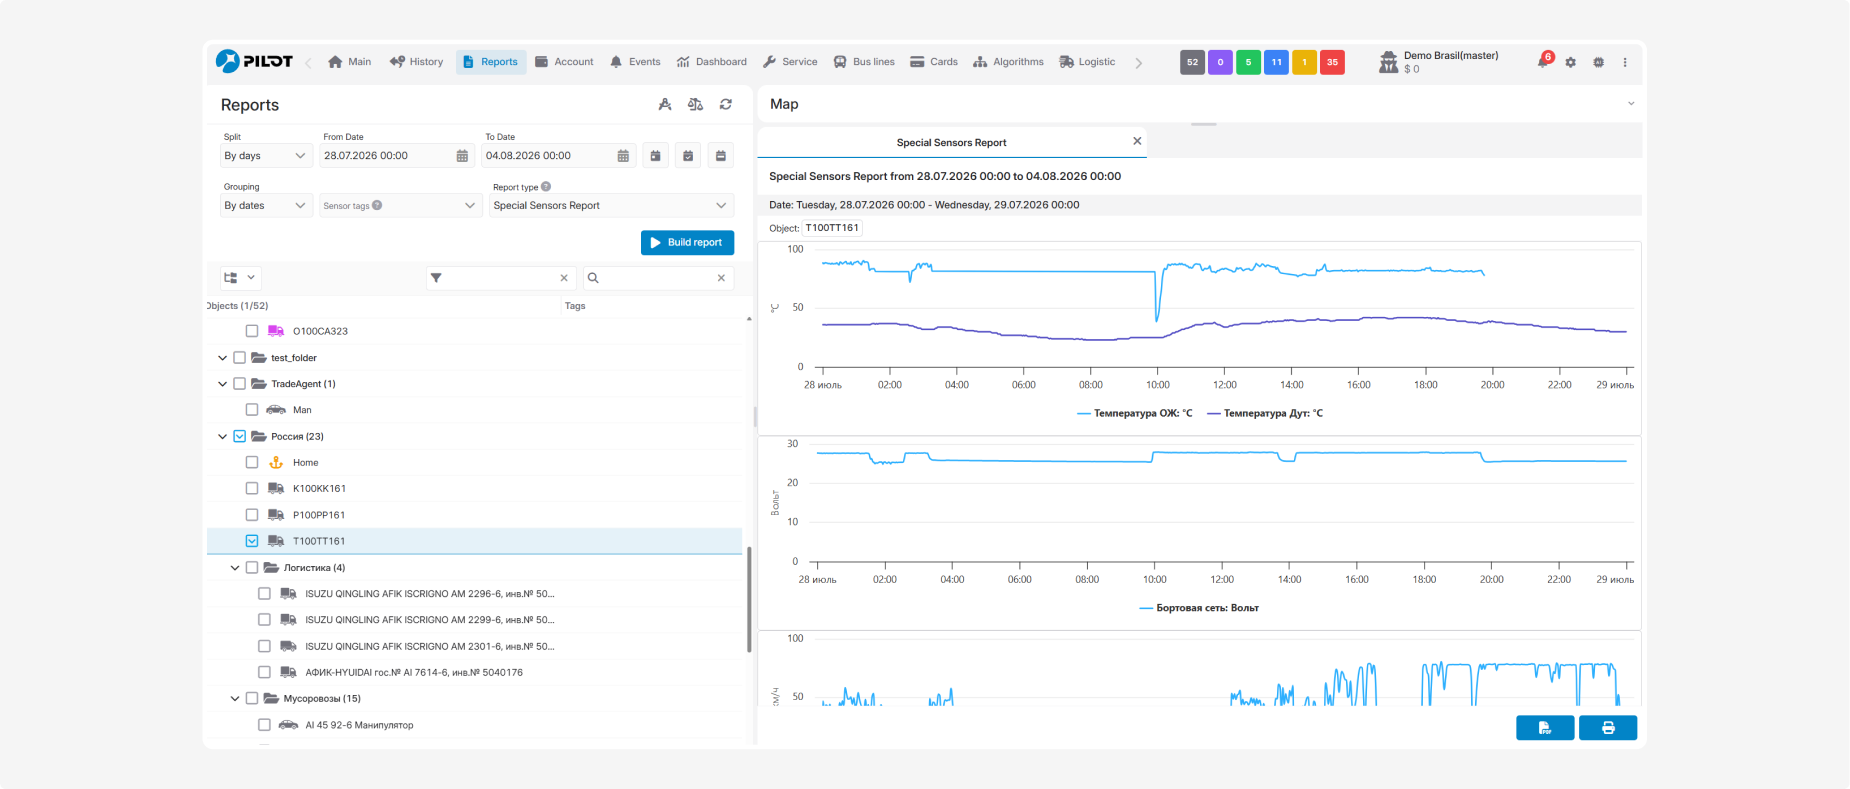
What the graph shows
-
the date and time when the data was received on the horizontal axis
-
sensor readings in the corresponding units of measurement on the vertical axis
-
different sensors or parameters as lines of different colors
-
the exact time and recorded value when you hover over a line
The sensor name displayed on a chart matches the name assigned to that sensor in the object settings.
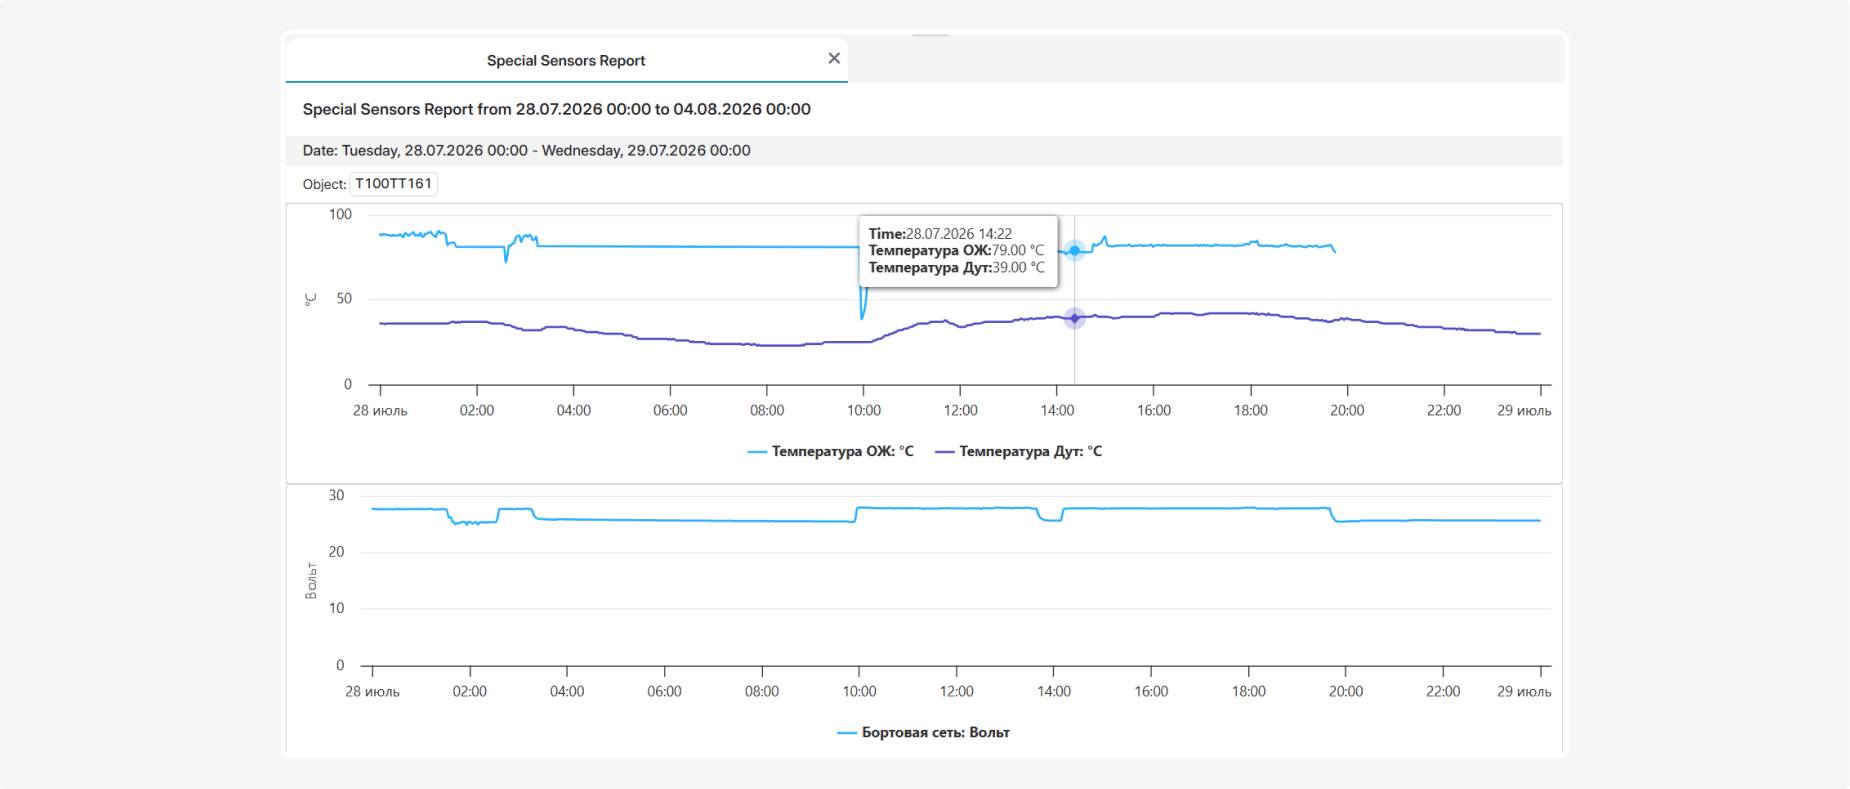
Sharp rises and drops in a line indicate changes in the corresponding parameter. Horizontal sections indicate that the value remained relatively stable.
Special sensors must be added to the object and configured correctly before their readings can be displayed. If a sensor is missing, configured incorrectly, or did not transmit data during the selected period, its chart may not appear in the report.