Temperature report
The Temperature Report shows how temperature sensor readings changed over the selected period. A separate chart is generated for each day and monitoring object.
The horizontal axis shows time, while the vertical axes show temperature and humidity. Sensor readings are represented by lines of different colors. Horizontal gray lines indicate the limits of the permitted temperature range.
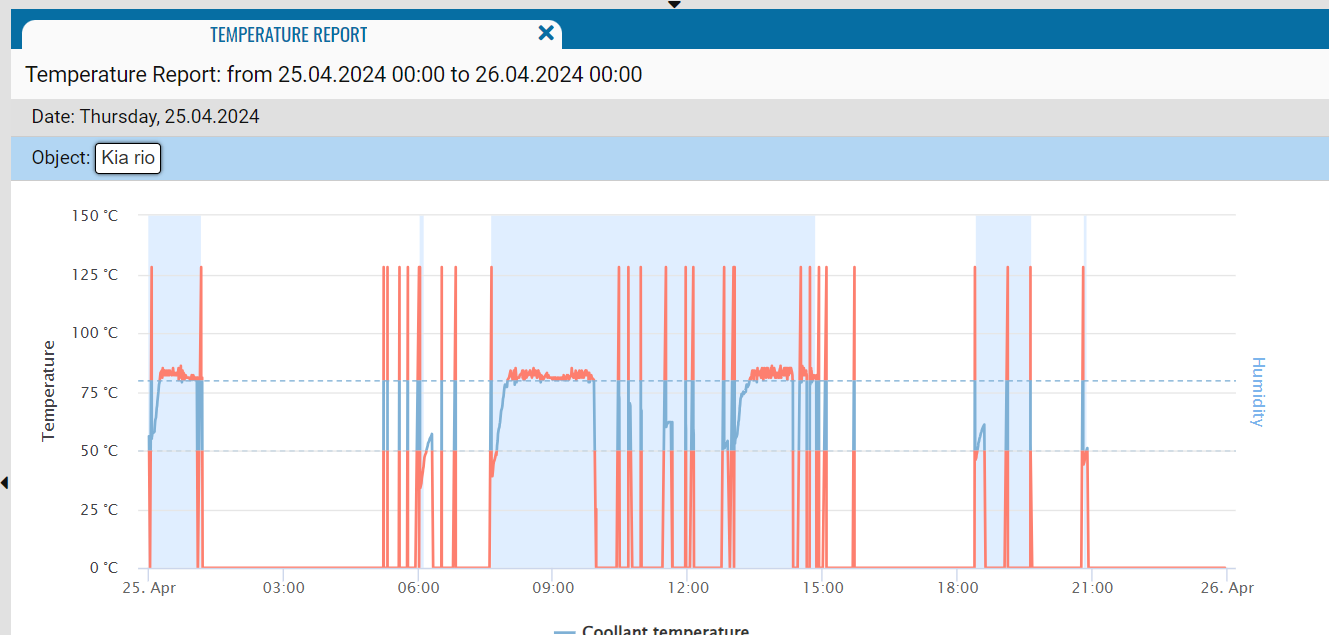
When you hover over the chart, a tooltip displays the date, time, and sensor readings at the selected point.

If you open the map panel and select a point on the chart, the object’s location at the corresponding time appears on the map. This allows you to compare temperature changes with the object’s route.

How to configure a temperature sensor
Configuring the temperature sensor correctly helps ensure that the report contains accurate equipment or vehicle data. Working ranges and filters allow the system to detect deviations and exclude invalid readings.
A temperature sensor is added in the same way as any other sensor. For more information about adding sensors, see this article.

To configure a temperature sensor:
1. Add a sensor
2. Enter its name and description
3. Select the sensor type from the drop-down list
4. Specify the data field. Select the parameter from which the system should retrieve temperature readings, such as engine_temp. Make sure you select the field in which the device transmits the actual temperature
5. Set the minimum and maximum thresholds. These thresholds define the sensor’s working range—the limits within which its readings are considered normal. If a reading falls outside this range, the system records a deviation. The range limits are shown as gray lines on the chart
6. Configure the minimum and maximum value filters. Values outside the specified range are considered invalid and are automatically excluded from reports. This allows the system to filter out sensor errors and incorrect readings