Working with history
This article explains the history functions that help track an object’s movement and parameters and work with the collected data.
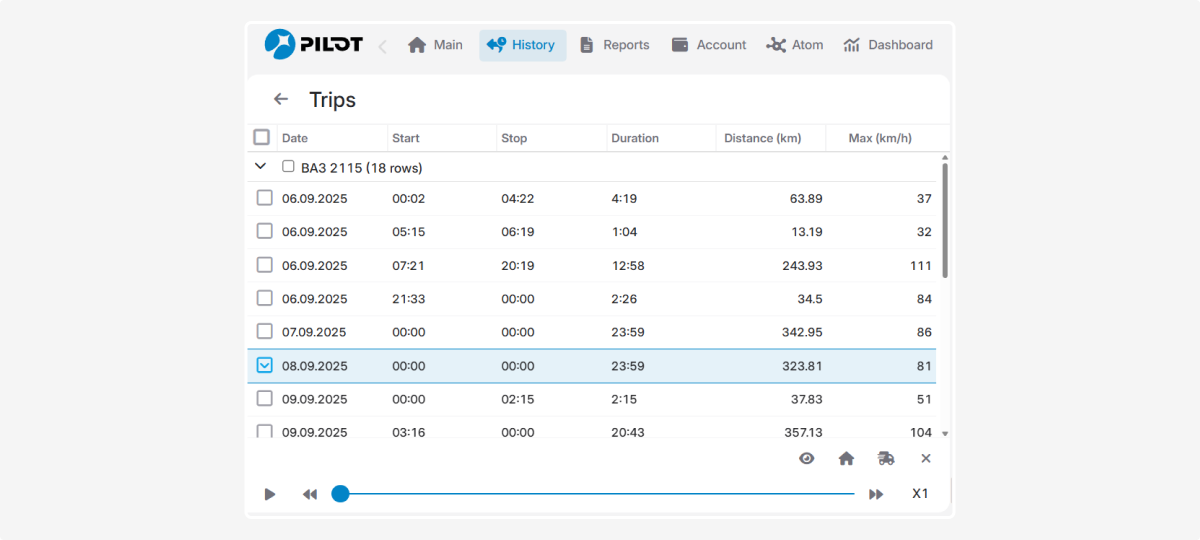
After selecting the time period and parameters for building the history, the search results display a track list.
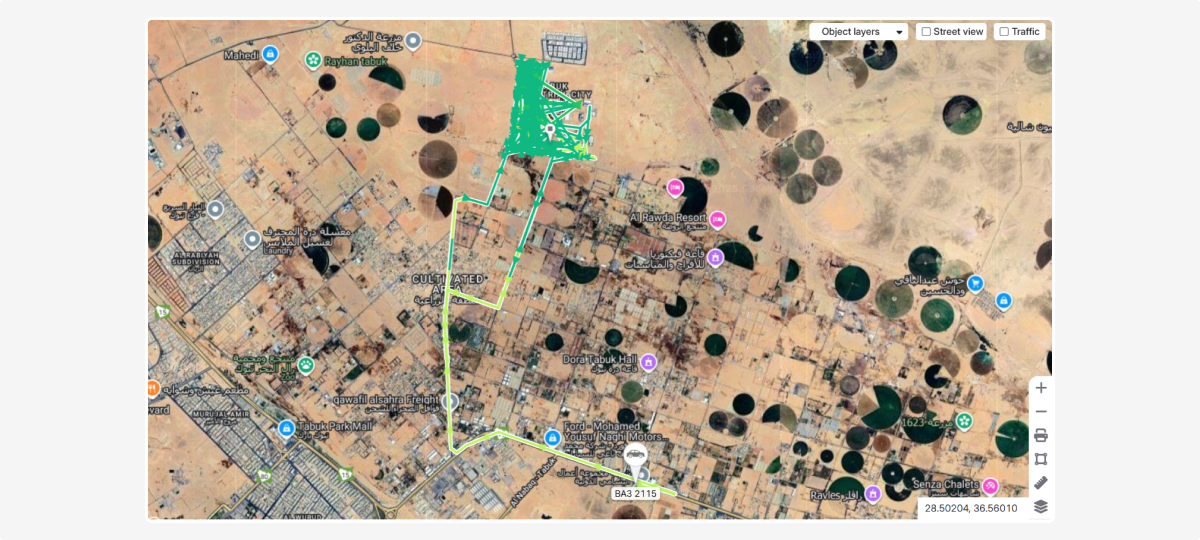
A track is a line on the map showing the object’s movement path. It consists of points marking the locations where the object was at different times.
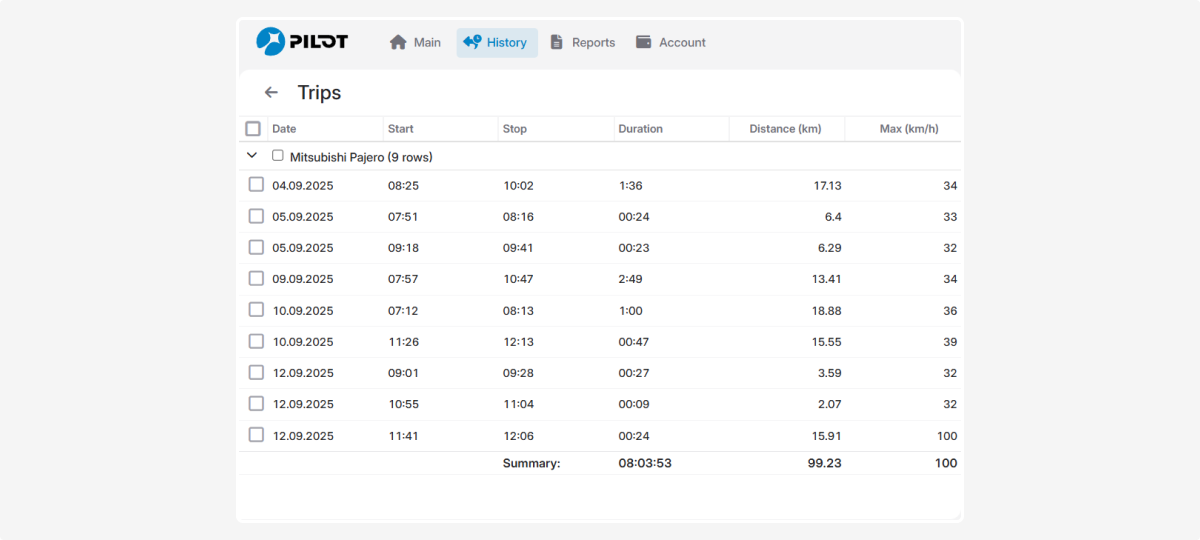
The list consists of track records with parameters such as track date, start, stop, duration, distance, and maximum speed of the object.
To adjust the parameters that affect track construction, go to Object settings.
|
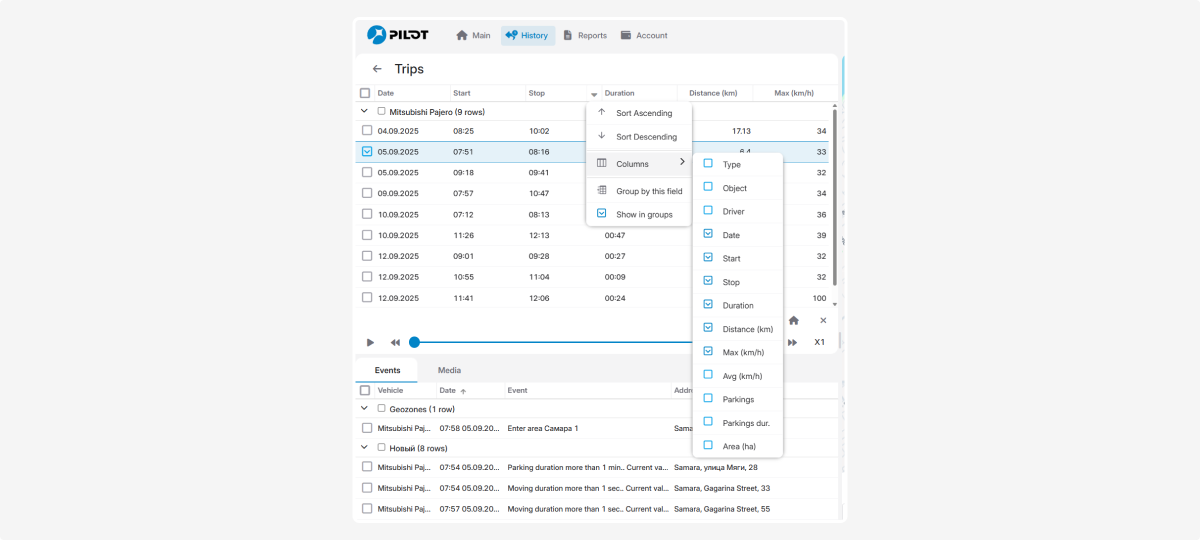
Customize the track list as you like. Choose which columns with parameters to display, for example, parking or stop duration.
How to configure the track record list:
-
In the header of any column, click the arrow
 . A column settings menu will appear where you can:
 -
Sort the data ascending or descending
-
Select which columns to show on the screen
-
Group records by the selected parameter
2. To configure which columns to show:
-
Click Columns — a list of available parameters for display will open
-
Check the boxes next to the parameters you want to see
The player allows you to view how the object moved in the past.
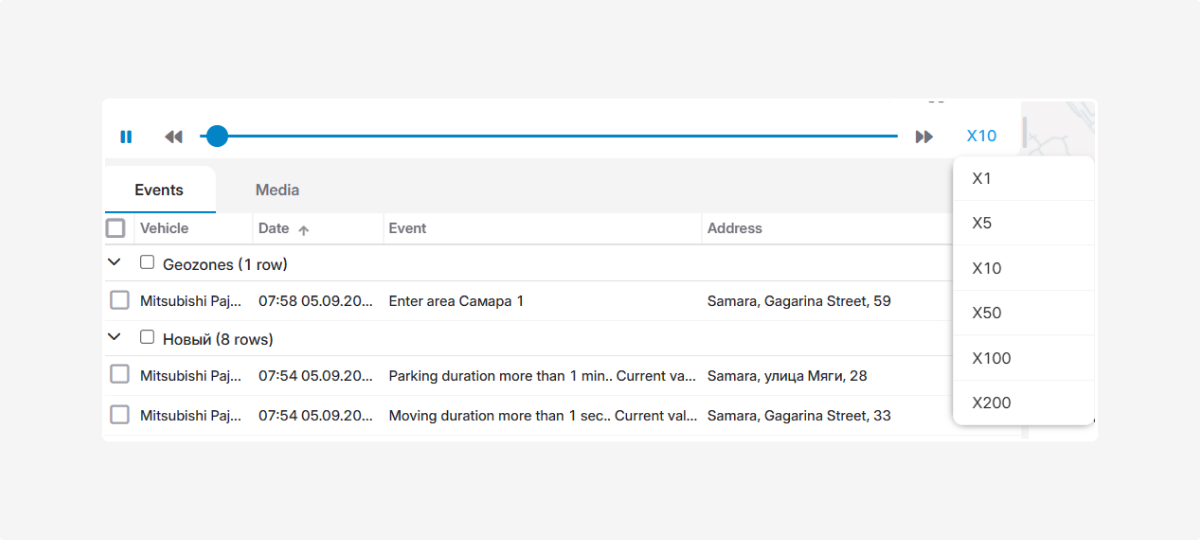
Click the Start 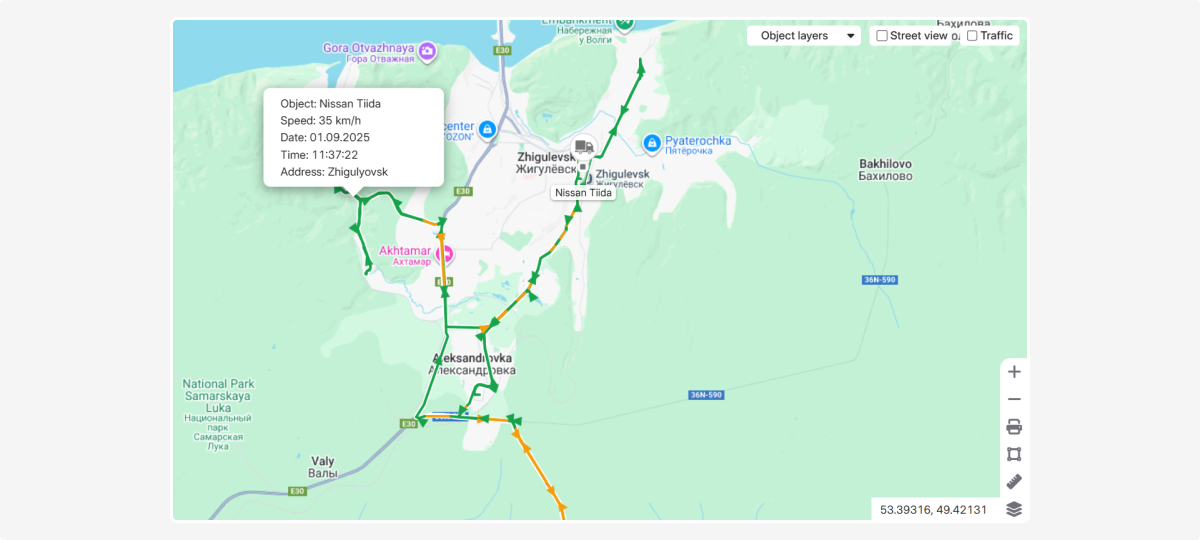 button to begin playback.
Watch the object’s movement on the map and the speed chart at the bottom of the screen.
Next to the player, you will see the date, time, and current speed of the object at a given moment.
To speed up playback, click the speed increase button — this helps to review long routes faster.
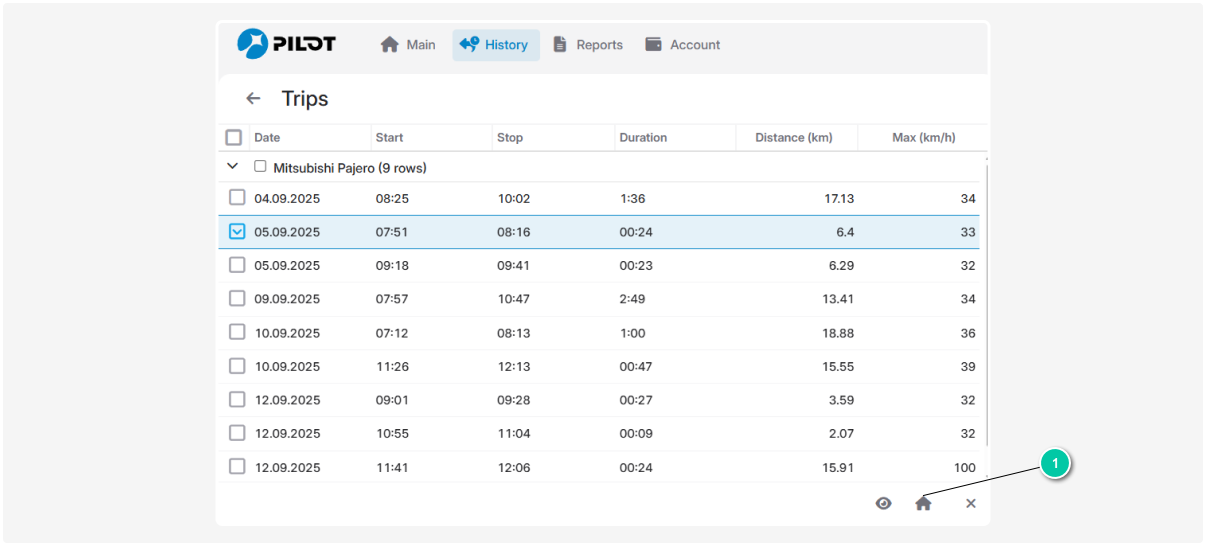
When a track record is selected, the system displays the object’s movement route on the map. You can add multiple tracks to the map simultaneously, for example, to compare routes of one or several objects over different periods.
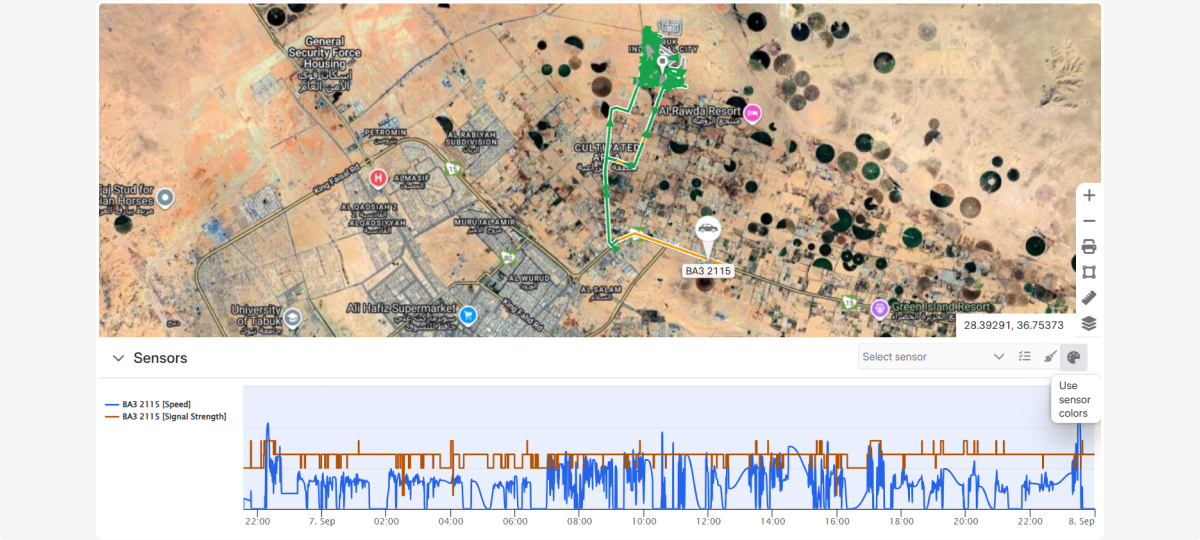
Tracks can be displayed in different colors depending on the selected parameters.
The speed color is configured in the Speed in Color section under the Map and Geocoding tab. Route segments are colored according to the object’s speed.
The track is colored according to the readings of a selected multi-position sensor along the entire route.
To display a track with color-coded sensor readings:
-
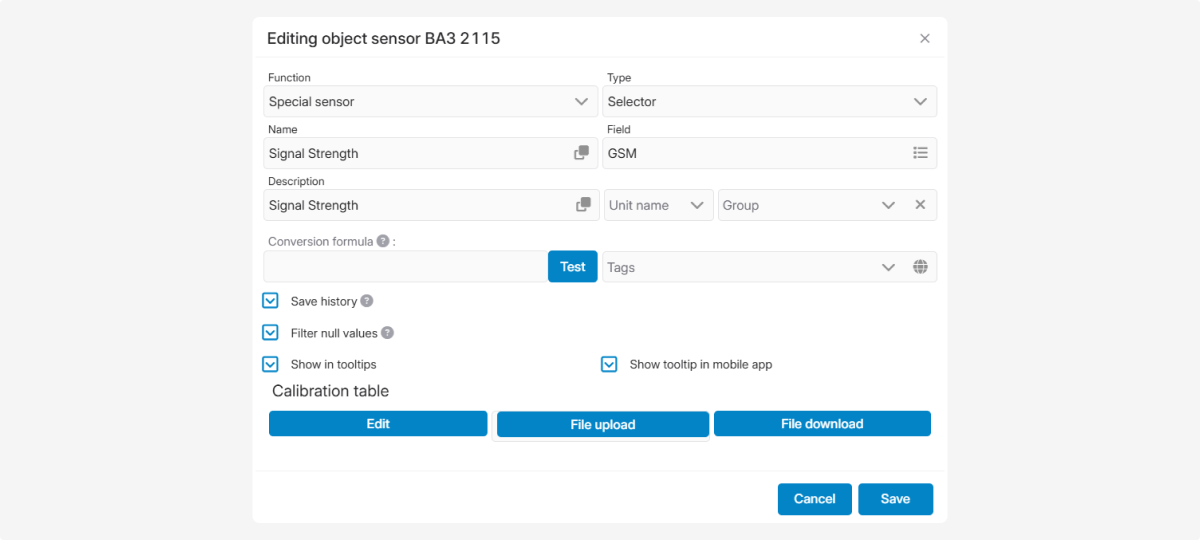
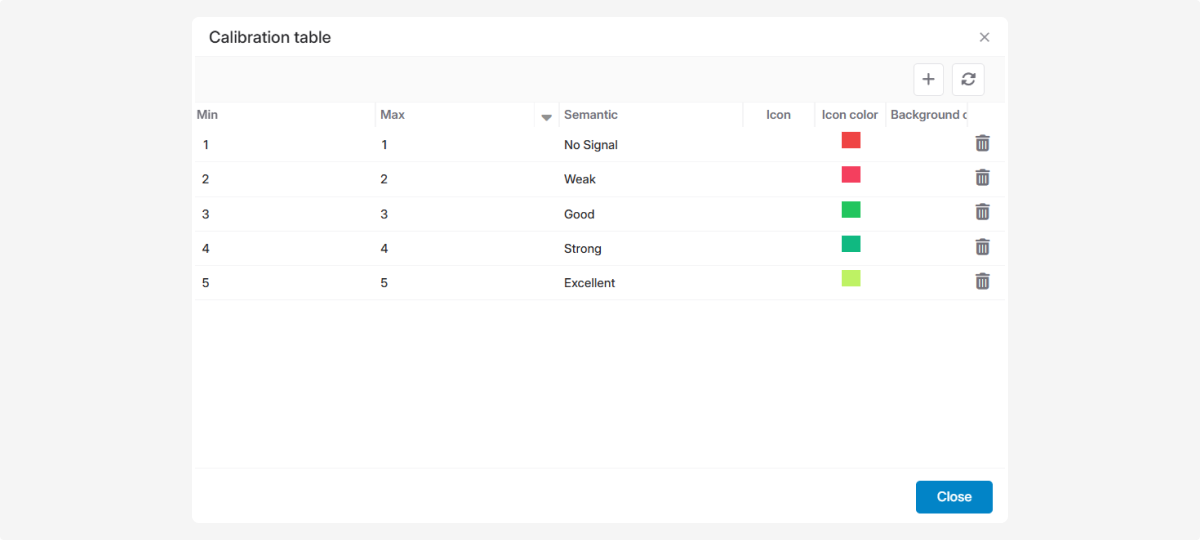
Make sure the sensor is configured and has colors set in the calibration table
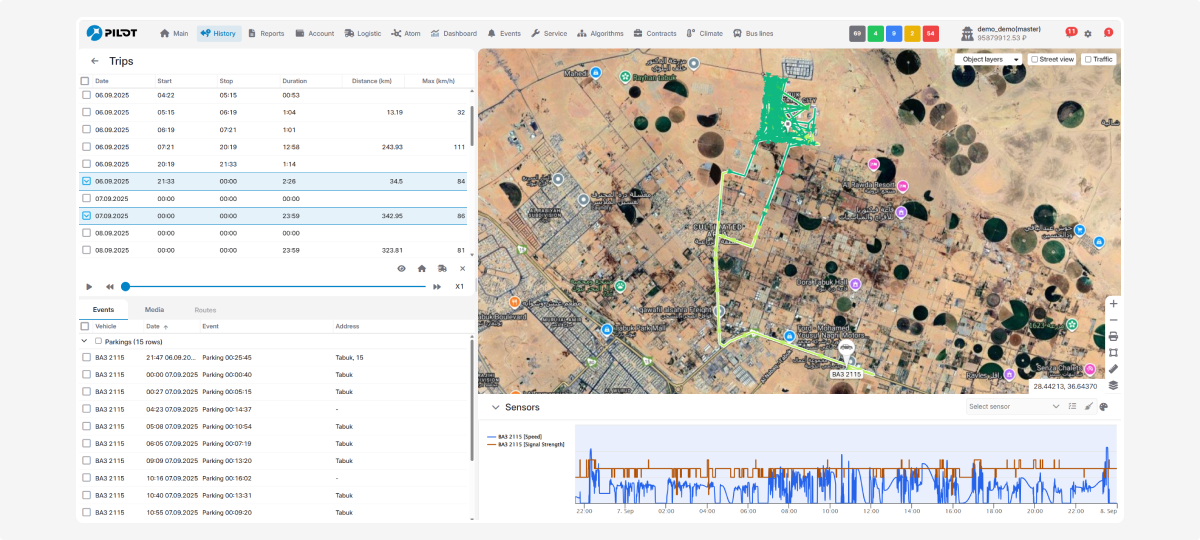
2. Build the object’s movement history by selecting tracks in History
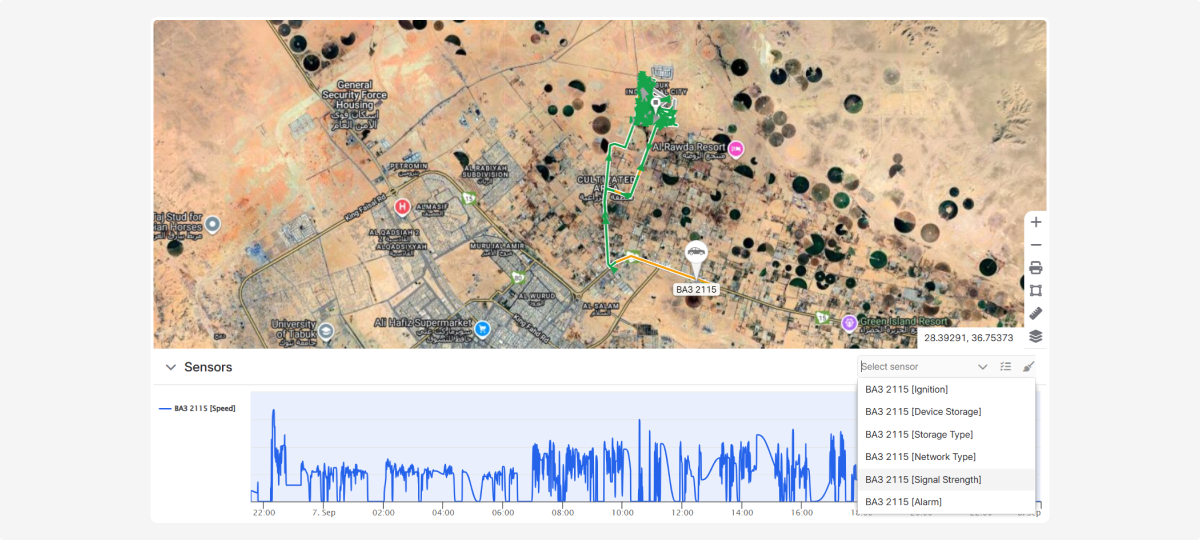
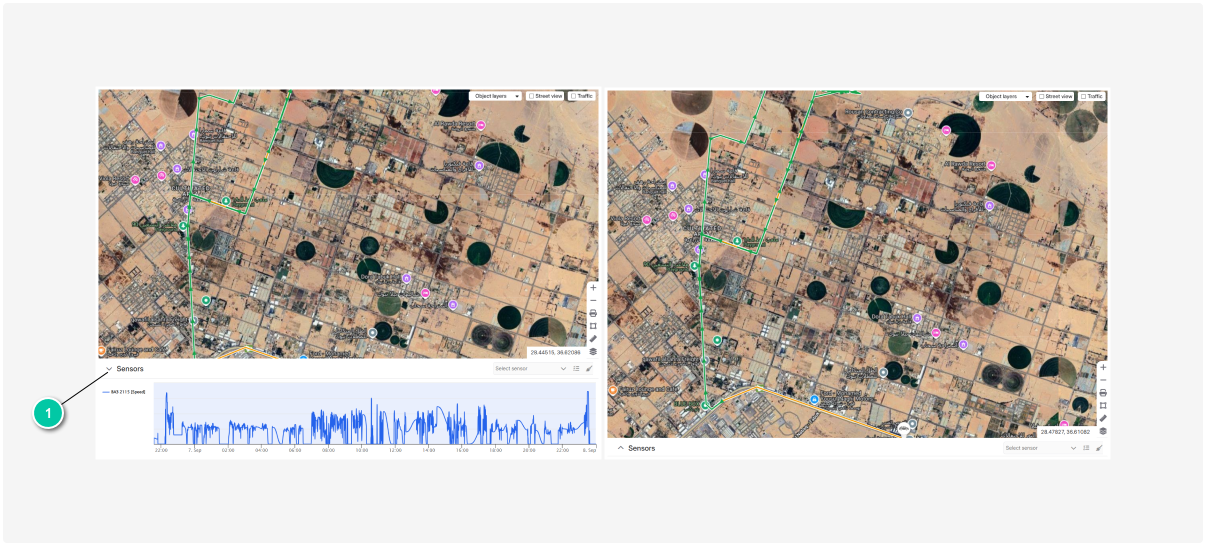
3. After the track appears, locate the sensor list panel at the bottom of the map

4. Select the desired sensor from the list
5. Click the palette button that appears
6. The track on the map will be colored according to the sensor readings at each point along the route
To enlarge the map area, collapse the bottom chart panel by clicking the Collapse chart panel button. 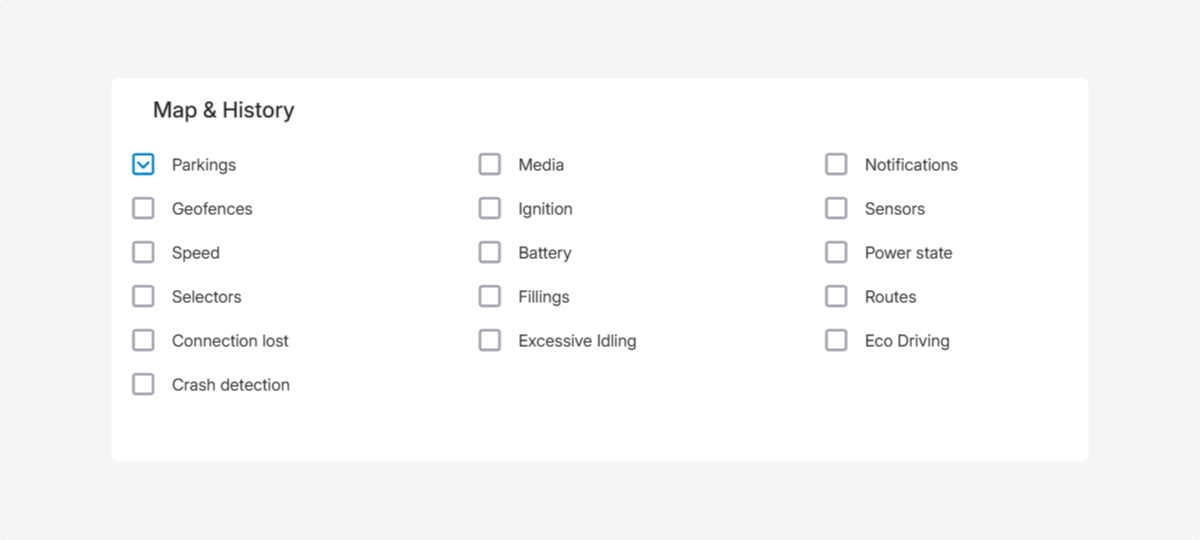
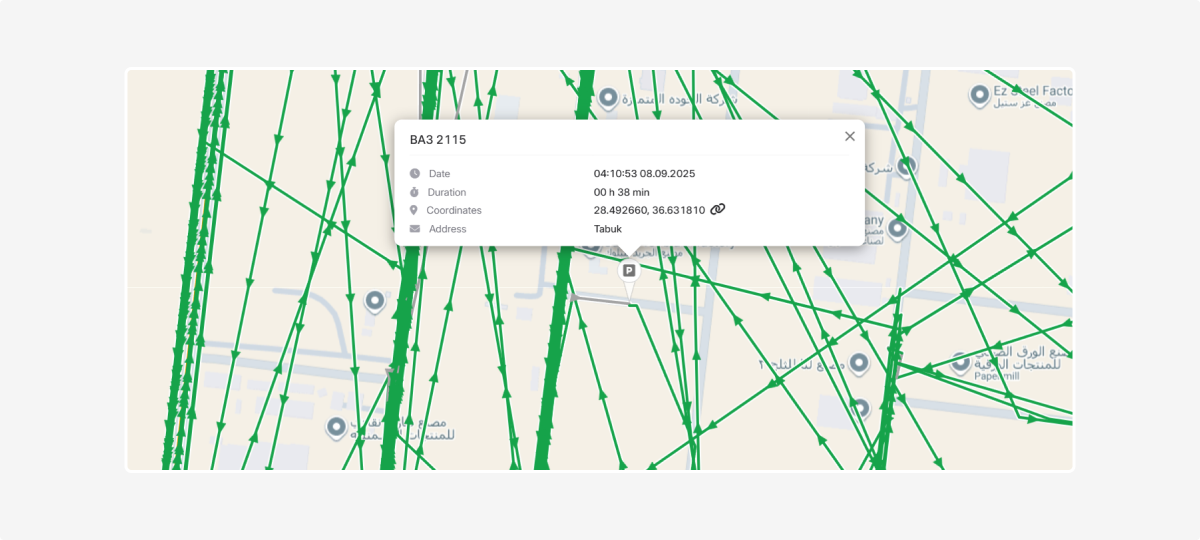
Special icons on the map indicate important events that occurred during movement, such as fuel thefts, speeding, or parking. Click on a marker to get detailed information about the event.
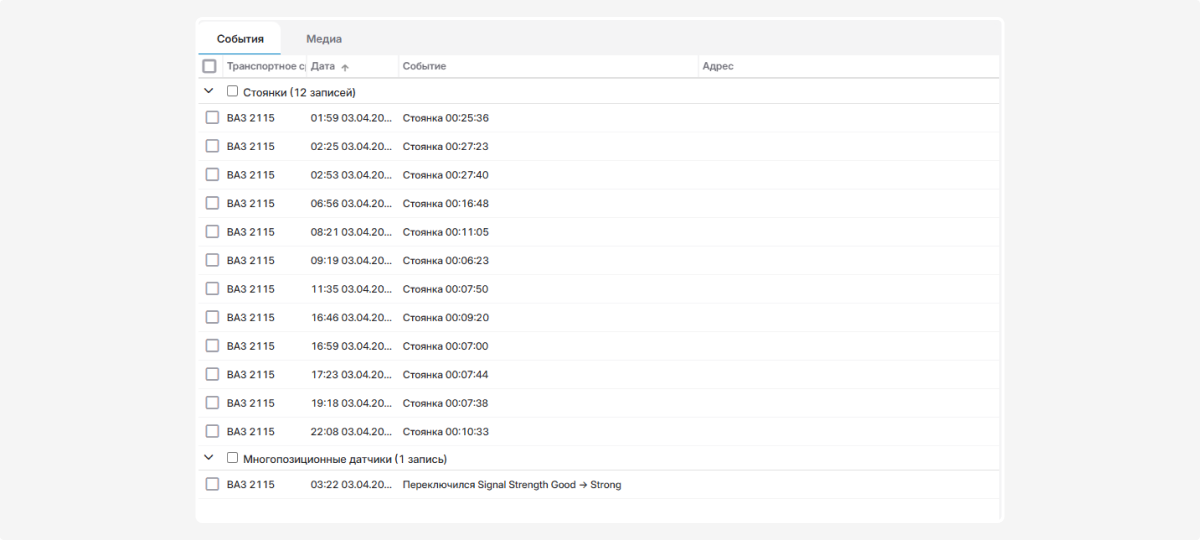
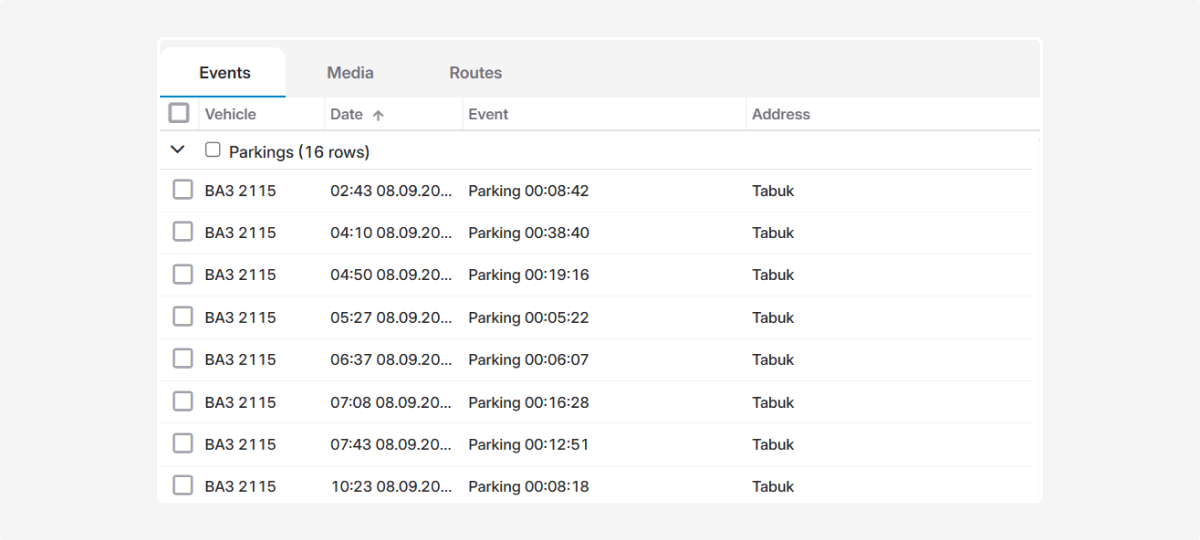
Events in History are actions that occurred with the object. They are displayed in the Events tab.
In the Map and geocoding tab, you can configure which types of events are displayed in History.
To view events in History:
-
Build the object’s history and select tracks
2. Go to the Events tab. All actions of the object on the selected track will appear
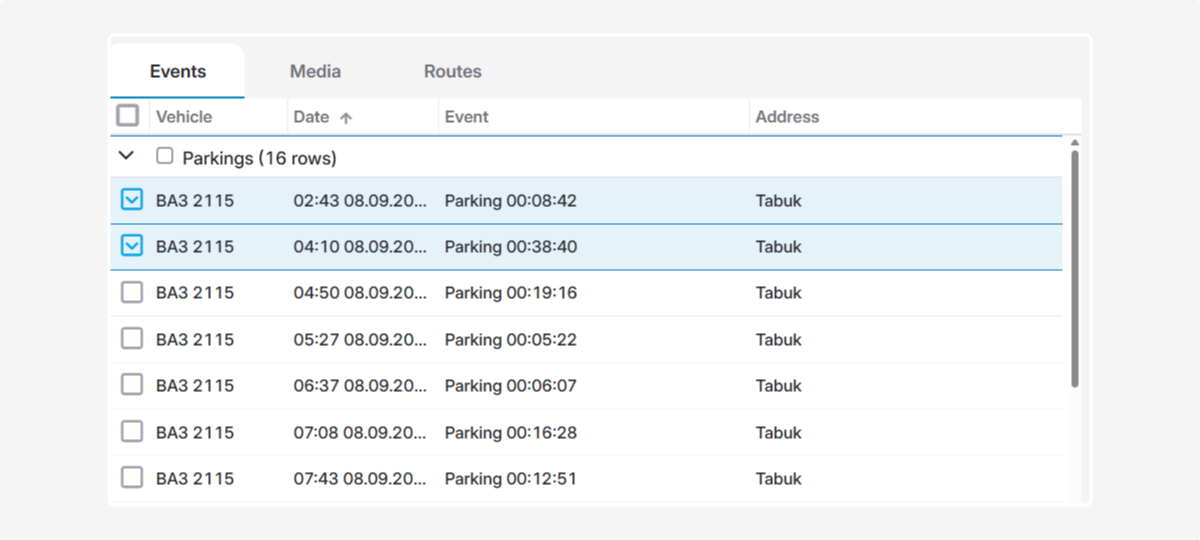
3. Check the boxes next to the events you want to see on the map
4. Go to the map to view the selected events along the track
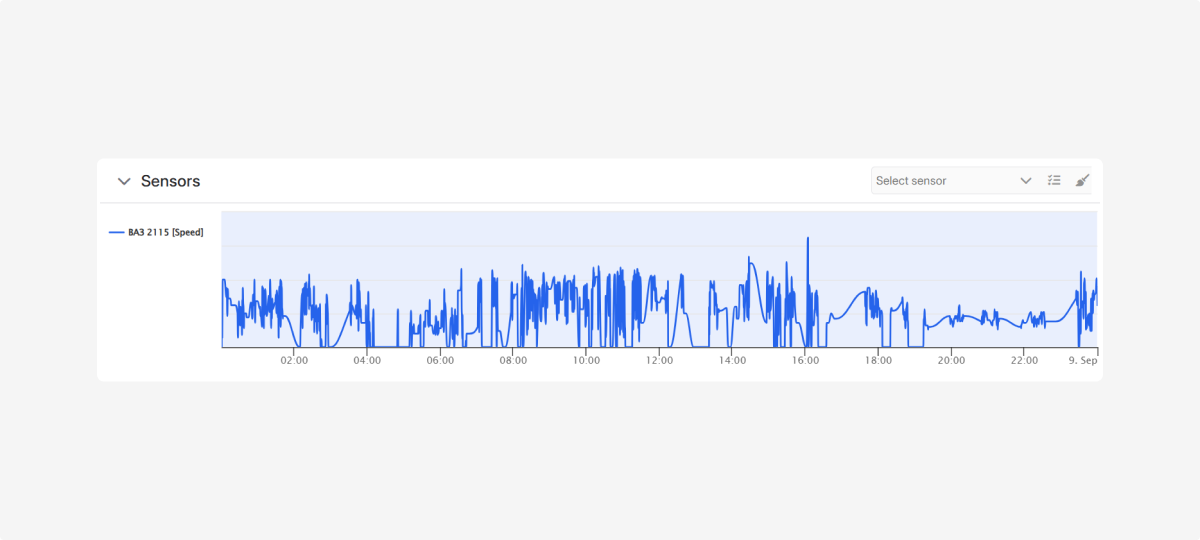
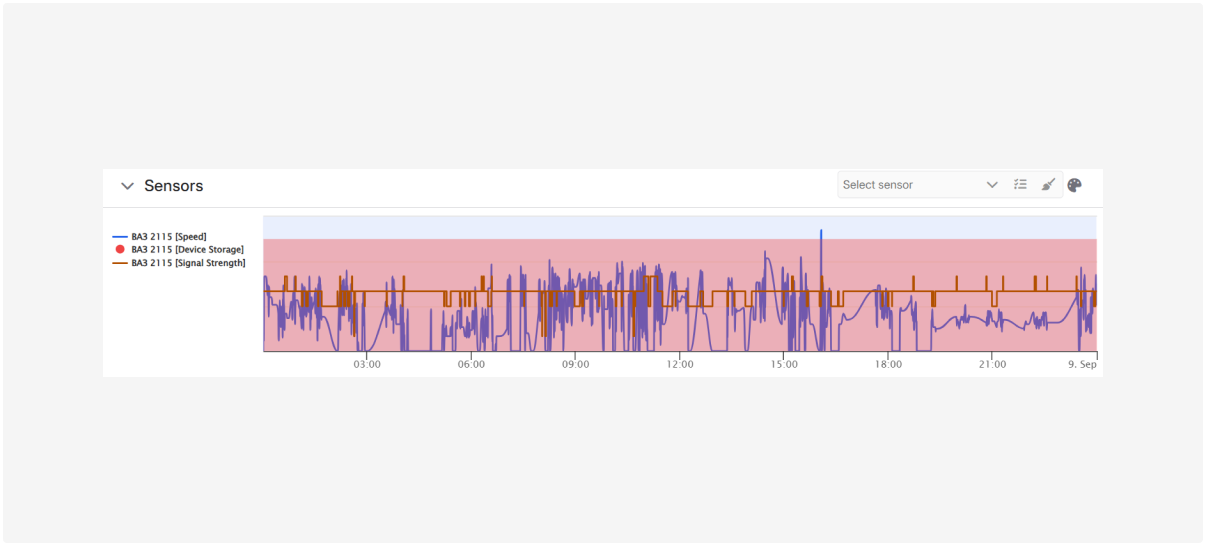
The chart displays the object’s speed and sensor readings.
When a track is selected, only speed is displayed on the chart by default.
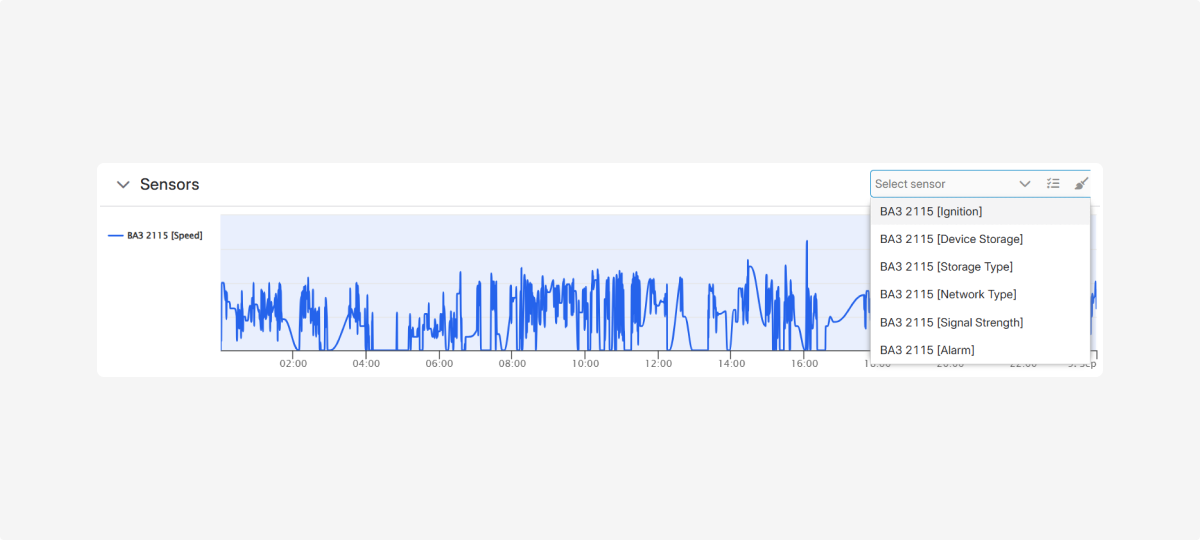
To add sensor readings, select the desired sensors from the sensor panel. Their values will appear on the chart.

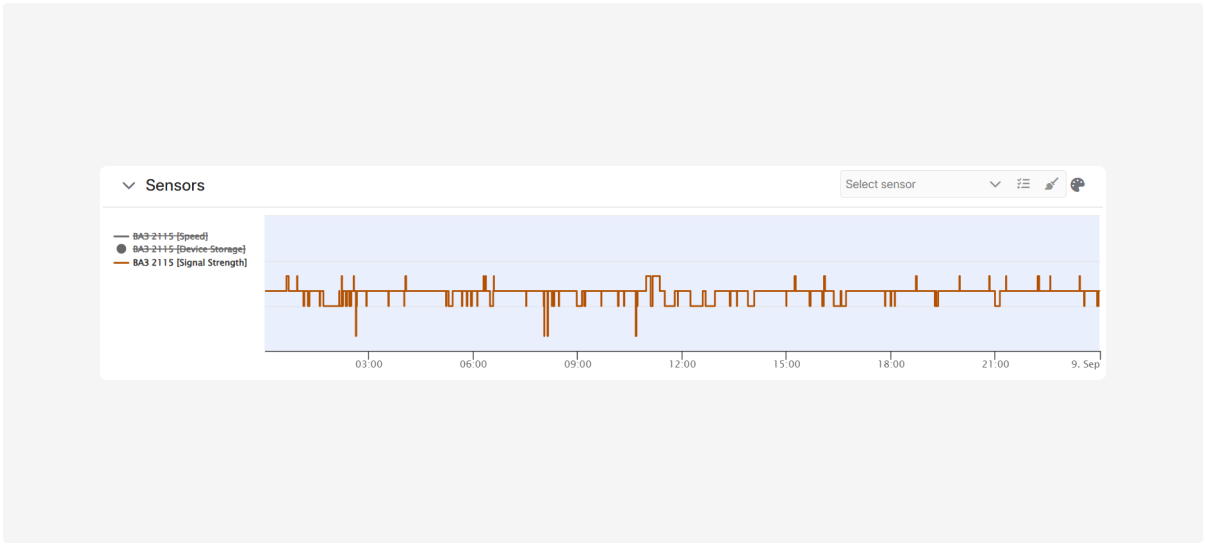
To temporarily hide a sensor’s data, click its name to the left of the chart. The name will be crossed out, and its line will disappear. Clicking again will restore the display.

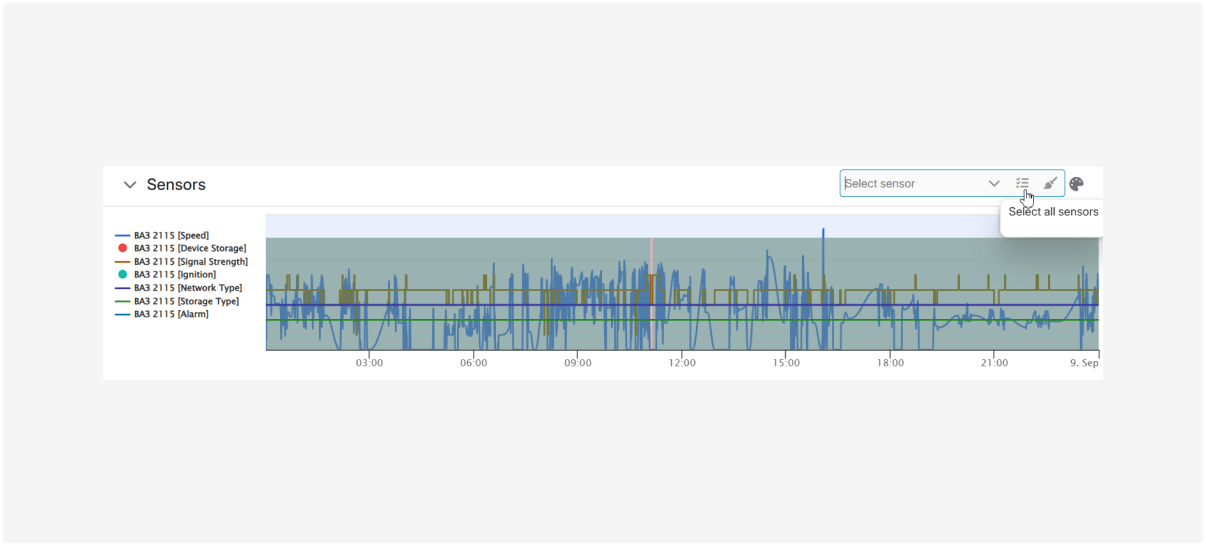
Click Select all sensors to display all available readings.

Click Clear  to remove all selected readings from the chart.
Watch the video “How to view fuel consumption chart in the History” to quickly learn how to monitor fuel usage and analyze refueling/draining events.
|